

 800+ IT
News
als RSS Feed abonnieren
800+ IT
News
als RSS Feed abonnieren📚 Automate Streamlit Web App using Interactive AgGrid with Google Sheets
💡 Newskategorie: AI Nachrichten
🔗 Quelle: towardsdatascience.com
Customizable AgGrid data table connected to a Google Sheets database

TL;DR
- The blog post demonstrates how to use the AgGrid library in a Streamlit app to create an interactive data table.
- It shows how to connect the table to a Google Sheets database and send data from the table to the database.
- Additionally implementing JavaScript callbacks for adding rows to the AgGrid table.
1. Introduction
Streamlit is a popular open-source framework for building data science and machine learning apps. It allows developers to create interactive, web-based applications using simple Python code. However, the built-in data table component in Streamlit has limited functionality and is not always suitable for more advanced use cases. This is where the AgGrid library comes in. AgGrid is a powerful JavaScript library that can be used to create interactive data grids and tables.
Implementing AgGrid in a Streamlit app can be particularly useful for data scientists and machine learning engineers who want to build user-friendly applications that allow users to view, manipulate, and analyze data. AgGrid provides a variety of features, such as filtering, sorting, and aggregation, that can help users better understand and work with large datasets. It also supports a wide range of data types, including numbers, strings, and dates, and can be customized to fit the needs of the application.
In this blog post, we will demonstrate how to use AgGrid in a Streamlit app and connect it to a Google Sheets database. We will show you how to create a customizable data table, send data from the table to the database, and add rows to the table using a JavaScript function.
2. Prerequisites
To follow along with this blog post, you will need to have the following libraries installed:
- streamlit: This is the main Streamlit library, which is used to build interactive data applications in Python. To install it, you can use the following command: pip install streamlit
- pandas: This library is used for data manipulation and analysis in Python. It is used to read/write data and create a DataFrame in our use-case. The DataFrame is a tabular data structure that can be used to store and manipulate data. To install it, you can use the following command: pip install pandas
- st_aggrid: This is a Streamlit extension or a wrapper that provides integration with the AgGrid library. It is used to create and customize the data table. To install it, you can use the following command: pip install st_aggrid
- gspread: This is a Python library for interacting with Google Sheets. It is used to connect to the Google Sheets database. To install it, you can use the following command: pip install gspread
- google-auth and google-auth-oauthlib: These libraries are used for authentication with Google services. They are required for the gspread library to work. To install them, you can use the following command: pip install google-auth google-auth-oauthlib
Alternatively, you can install these libraries together using the following command from your terminal,
# Installation of the dependencies
pip install streamlit pandas st_aggrid gspread
3. Setting up a simple AgGrid table
Once we have our dependencies installed, we can start by creating a dummy DataFrame that we will use to populate our AgGrid table. We will begin by importing the necessary libraries and creating a sample DataFrame,
# Importing the dependencies

import streamlit as st
import pandas as pd
from st_aggrid import AgGrid, JsCode
from st_aggrid.grid_options_builder import GridOptionsBuilder
# Creates a Streamlit header and an Expander
# to provide some context for the app.

st.header("AgGrid Demo `Part 3`")
with st.expander('🤩 What I plan to demonstrate today ? ', expanded=False):
    st.markdown('''

                ◻ 1. Implementing `button` within AgGrid table

                ◻ 2. Display any `update` made from the user-end

                ◻ 3. `Download` the AgGrid table

                ◻ 4. `Connect` to Database
                ''')

# Create an AgGrid table from a pandas DataFrame
d = {‘Type’:[‘Notebook’, ‘DVDs’] ,’Quantity’: [1, 2],’Price’: [400, 200]}
df = pd.DataFrame(data = d)
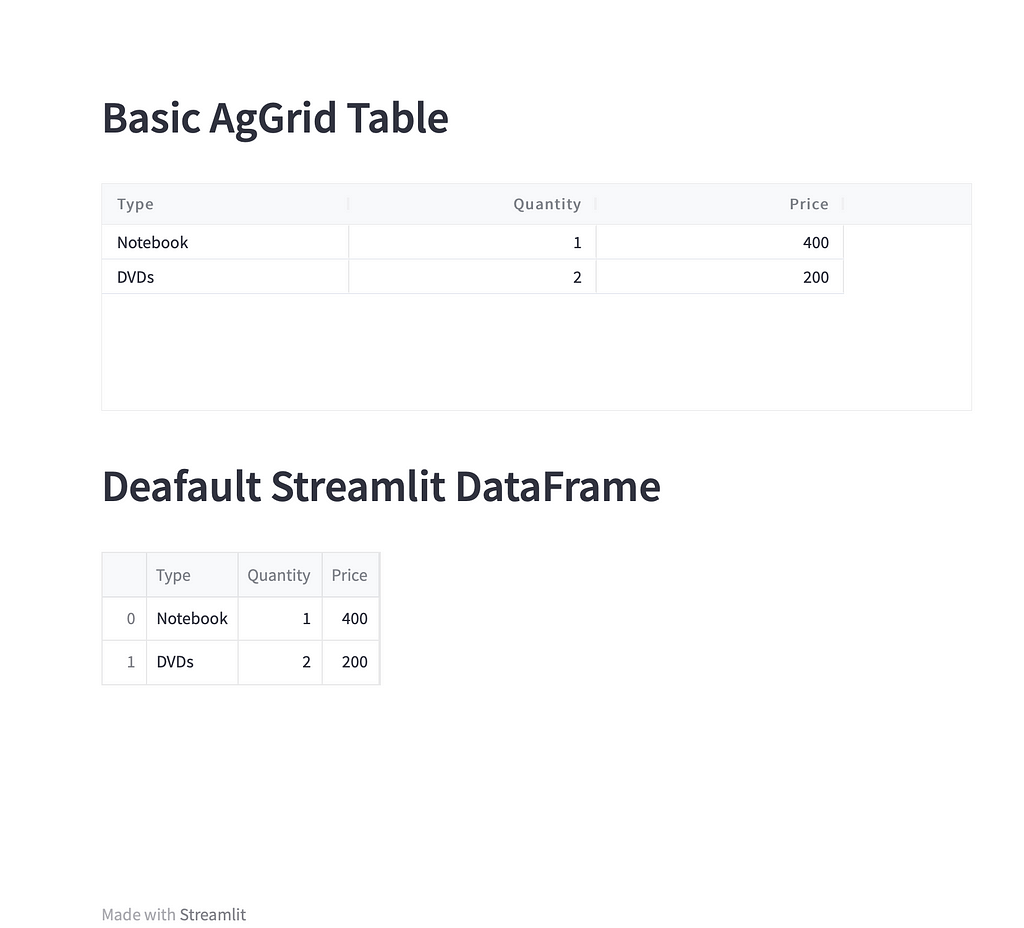
Now that we have a sample DataFrame, we can display it as an AgGrid table in Streamlit using the AgGrid function:
# Display the Dataframe in AgGrid
AgGrid(df)
This will give us a basic AgGrid table with our dummy data, but it is not very interactive. To make our AgGrid table more interactive, we can use JavaScript to add features such as cell renderers and on-cell clicked events.
4. Implementing a button that allows adding a new row to the AgGrid table
To add a button to the AgGrid table, we need to create a custom cell renderer using JavaScript. A cell renderer is a function that returns the HTML element to be displayed in a cell.
We will start by creating a JavaScript function that adds a new row to the AgGrid table when the button is clicked. To do this, we will use the applyTransaction method provided by the AgGrid API. This method allows us to make changes to the grid by applying a transaction. In this case, we are using the add transaction to add a new, empty row to the table at the index specified by rowIndex.
# JavaScript function to add a new row to the AgGrid table
js_add_row = JsCode ('''
function(e) {
 let api = e.api;
 let rowPos = e.rowIndex + 1;
 api.applyTransaction({addIndex: rowPos, add: [{}]})
};
'''
)
Next, we will define a cell renderer that will render a button in each cell of the '🔧' AgGrid column. The cell renderer is a class that defines how the cell should be rendered. In this case, we are using an HTML button element to render the button. The button will have an onclick event that calls the js_add_row function when clicked. We are also applying some basic CSS styles to the button to give it a visually appealing look.
# Cell renderer for the '🔧' column to render a button
cellRenderer_addButton = JsCode('''
class BtnCellRenderer {
init(params) {
this.params = params;
this.eGui = document.createElement('div');
this.eGui.innerHTML = `
<span>
<style>
.btn_add {
background-color: #71DC87;
border: 2px solid black;
color: #D05732;
text-align: center;
display: inline-block;
font-size: 12px;
font-weight: bold;
height: 2em;
width: 10em;
border-radius: 12px;
padding: 0px;
}
</style>
<button id='click-button'
class="btn_add"
>↓ Add</button>
</span>
`;
}
getGui() {
return this.eGui;
}
};
''')
5. Visualizing the AgGrid with button functionality
Now that we have defined our JavaScript functions, we can create an AgGrid table and configure it to display our button. To do this, we will first create a GridOptionsBuilder object from our pandas DataFrame using the from_dataframe method. This will create a default configuration for our AgGrid table based on the data in the DataFrame.
Next, we will use the configure_column method to specify that the column with field name '🔧' should use our cellRenderer_addButton cell renderer, and we will also specify that the onCellClicked event should trigger our js_add_row JavaScript function.
# Create a GridOptionsBuilder object from our DataFrame
gd = GridOptionsBuilder.from_dataframe(df)

# Configure the default column to be editable
# sets the editable option to True for all columns
gd.configure_default_column(editable=True)

# Configure the '🔧' column to use our the cell renderer
# and onCellClicked function
gd.configure_column( field = '🔧',
                     onCellClicked = js_add_row,
                     cellRenderer = cellRenderer_addButton,
                     lockPosition='left')
                    )
gridoptions = gd.build()
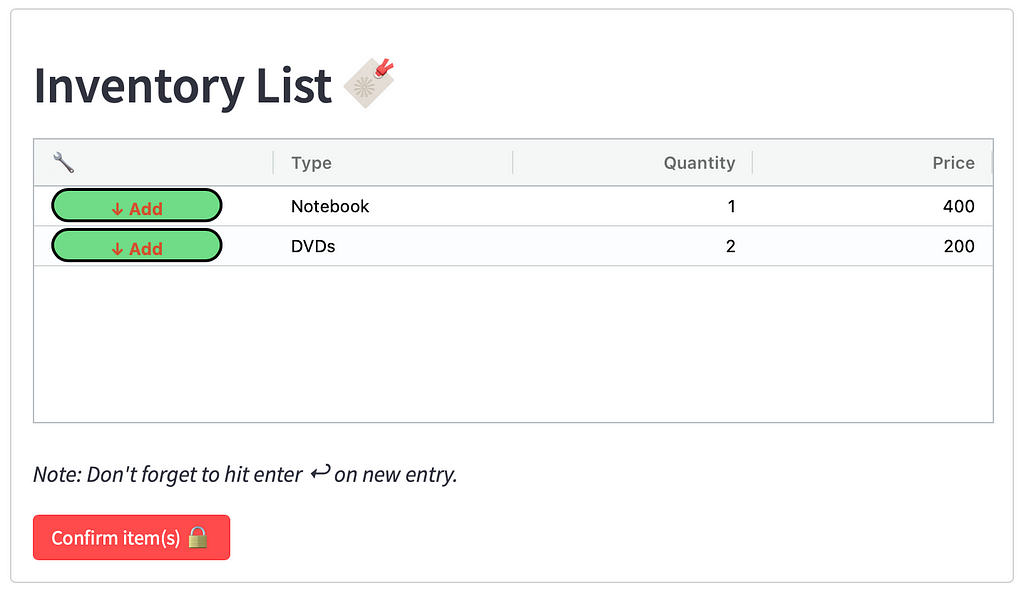
Finally, we can create our AgGrid table using the AgGrid function and passing in our GridOptionsBuilder object. Note, for the sake of simplicity from the user-interface perspective, we are using the st.form() layout to create a form in Streamlit front-end. The form has a header that reads “Inventory List 🔖” and a submit button labeled “Confirm item(s) 🔒”. The arguments used within the AgGrid function are well-commented in the code block.
# AgGrid Table with Button Feature
# Streamlit Form helps from rerunning on every widget-click
# Also helps in providing layout

with st.form('Inventory') as f:
    st.header('Inventory List 🔖')

# Inside the form, we are displaying an AgGrid table using the AgGrid function.
# The allow_unsafe_jscode parameter is set to True,
# which allows us to use JavaScript code in the AgGrid configuration
# The theme parameter is set to 'balham',
# which applies the Balham theme to the table
# The height parameter is set to 200,
# which specifies the height of the table in pixels.
# The fit_columns_on_grid_load parameter is set to True,
# which ensures that the columns of the table are resized to fit
# the width of the table when it is first displayed

    response = AgGrid(df,
                    gridOptions = gridoptions,
                    editable=True,
                    allow_unsafe_jscode = True,
                    theme = 'balham',
                    height = 200,
                    fit_columns_on_grid_load = True)
    st.write(" *Note: Don't forget to hit enter ↩ on new entry.*")
    st.form_submit_button("Confirm item(s) 🔒", type="primary")
That’s it! Now you should have a working AgGrid table with a button in each cell of the '🔧' column that adds a new row to the table when clicked.
6. Fetching the AgGrid data in form of table or plots
The data from the table can be easily fetched. Whenever the user at the front end confirms any changes in the AgGrid table and triggers the st.form_submit_button() , the st.table function is used to display the updated data from the AgGrid table in a table format.
# Visualize the AgGrid when submit button triggered
st.subheader("Updated Inventory")
# Fetch the data from the AgGrid Table
res = response['data']
st.table(res)
We then use the st.bar_chart function to display a bar chart of the data from the AgGrid table, using the Type column as the x-axis and the Price column as the y-axis.
# Plotting the data
st.subheader(“Visualize Inventory”)
st.bar_chart(data=res, x = ‘Type’, y = ‘Price’)
7. Saving AgGrid data locally or in the cloud
For the purpose of the aesthetics of the user interface, we create two columns using the st.columns function, and in the first column, we have a label that reads "Save in Local Machine?". In the second column, we aim to create a button that would update the AgGrid data to the connected Google Sheet.
a) Downloading locally: The csv variable is set to the result of calling the convert_df function on the data from the AgGrid table. When the button is clicked, the CSV file is downloaded with the name "file.csv".
# Function
@st.experimental_memodef
convert_df(df):
```Converts the data to a CSV format```
  return df.to_csv(index=False).encode(‘utf-8’)


st.subheader("Store Inventory")
col1,col2 = st.columns(2)
# https://docs.streamlit.io/knowledge-base/using-streamlit/how-download-pandas-dataframe-csv
csv = convert_df(response['data'])
col1.write("Save in Local Machine?")
col1.download_button(
   "Press to Download 🗳️",
   csv,
   "file.csv",
   "text/csv",
   key='download-csv'
)
b) Updating to the cloud in real-time: Google Sheets can be used as a cloud storage solution for storing and accessing data in a tabular format. The data can be accessed and modified by multiple users simultaneously, and changes are automatically saved and synced in real time.
Note, for this step, to obtain the service account information, you will need to create a Google Cloud Platform (GCP) project and a service account and then download the service account key file. The steps are well elaborated in the reference [3].
The following steps describe the code used (also the code is well commented for better understanding ),
- The code below first imports the service_account module and the gspread library. The gspread library is used to access and modify Google Sheets documents from Python.
# Importing the necessary Library
from google.oauth2 import service_account
import gspread

def send_to_database(res):
    # Create a list of scope values to pass to the credentials object
    scope = ['https://spreadsheets.google.com/feeds',
            'https://www.googleapis.com/auth/drive']

    # Create a credentials object using the service account info and scope values
    credentials = service_account.Credentials.from_service_account_info(
                st.secrets["gcp_service_account"], scopes = scope)

    # Authorize the connection to Google Sheets using the credentials object
    gc = gspread.authorize(credentials)

    # Open the Google Sheets document with the specified name
    sh = gc.open("AgGrid-Database")

    # Access the worksheet within the document with the specified name
    worksheet = sh.worksheet("Sheet1")

    # Set up a progress bar
    my_bar = st.progress(0)

    # Iterate through the rows of the data frame
    for ind in res.index:
        # Calculate the percentage complete
        percent_complete = (ind+1)/len(res)
        # Update the progress bar
        my_bar.progress(percent_complete)

        # Get the values in the first column of the worksheet
        values_list = worksheet.col_values(1)
        # Calculate the next empty row in the worksheet
        length_row = len(values_list)

        # Update the cells in the worksheet with the data from the data frame
        worksheet.update_cell(length_row+1, 1, res['Type'][ind])
        worksheet.update_cell(length_row+1, 2, str(res['Quantity'][ind]))
        worksheet.update_cell(length_row+1, 3, str(res['Price'][ind]))

    # Return a success message
    return st.success("Updated to Database ", icon="✅")\

# If the "Send to Database" button is clicked, execute the send_to_database() function
col2.write("Save in Shared Cloud?")
if col2.button("Send to Database"):
    send_to_database(res)
- The function begins by defining a list scope that specifies the permissions that the service account should have. In this case, the service account is granted access to the Google Sheets API and the Google Drive API.
- Next, we need to retrieve the necessary credentials to access our Google Sheets database. The code creates a Credentials object using the Credentials.from_service_account_info() method and passing in our service account information stored in the st.secrets dictionary. This method returns a Credentials object that can be used to authenticate the connection to Google Sheets and Google Drive.
- The gspread.authorize() method is then used to authenticate the connection to Google Sheets using the Credentials object. The gc.open() method is used to open the Google Sheets document with the name "AgGrid-Database", and the sh.worksheet() method is used to access the worksheet within the document with the name "Sheet1".
- The code then sets up a progress bar using the st.progress() method. It iterates through the rows of the DataFrame res, and for each row, it retrieves the values in the first column of the worksheet using the worksheet.col_values() method. The update_cell() method is then used to update the cells in the worksheet with the data from the data frame res.
- Finally, the code returns a success message using the st.success() method when all of the data has been written to the worksheet. The code also includes an if statement that executes the send_to_database() function when the button "Send to Database" is clicked.

8. Conclusion
In conclusion, the web app created using the lines of code above demonstrates the implementation of various features within an AgGrid table, including the ability to add a new row, display updates made by the user, download the table, and connect to a database. The app is easy to use, with a clean interface and intuitive features. Whether you’re looking to track inventory, update a to-do list, or manage any other data, this web app has you covered. The live demo of the app can be found here .
9. References
[1] A.Gadhir, How to add buttons in AG Grid cells,(2020)
[2] CSS Buttons — Basic Button Styling , W3CSS
[3] Connect Streamlit to a private Google Sheet, Streamlit (2021)
10. The Code
Here's the entire code, for a quick start, have fun!
https://medium.com/media/9d106d2d29cf2e7c201a78c1db4cb93c/hrefFeel free to write down your feedback. Tada !
Automate Streamlit Web App using Interactive AgGrid with Google Sheets was originally published in Towards Data Science on Medium, where people are continuing the conversation by highlighting and responding to this story.
...