

 800+ IT
News
als RSS Feed abonnieren
800+ IT
News
als RSS Feed abonnieren📚 Meaningful Experimentation: 5 Impactful Data Projects To Help Build Better Products
💡 Newskategorie: AI Nachrichten
🔗 Quelle: towardsdatascience.com
Part two in a practical data leader series on how to best work with each department and all their wonderful eccentricities

Understanding and aligning with each business domain’s unique incentives and workflows is what ultimately makes data teams not just efficient, but great.
Part one of this series looked at everyone’s favorite spreadsheet power users, the finance team. This article will examine how data teams can better identify the common causes and avoid points of friction with product teams.
While these interactions will certainly differ based on the nature of the product being delivered, this post will be applicable to a wide range of organizations that primarily offer a digital, consumer-facing product. Typically in these organizations cross-functional product teams (product managers, designers, engineers, etc) collectively own the end-to-end consumer experience and individually own aspects of that experience, such as features or products.
Let’s start by looking at some examples of impactful projects where data and product teams can find shared wins before diving into tips for driving meaningful collaboration.
Projects that will win over your product team
Product teams might own anything from an email to an app. They can be narrowly focused on a new feature or broadly evaluating an entirely new monetization strategy. However, there are some commonalities that can be drawn upon for product analytics best practices.
Here are five of those best practices I’ve seen that have driven results:
1. A data-informed product strategy
Product teams are tasked with being data-informed at all stages in the product life cycle, from idea generation and product definition, to validating prototypes and building a commercially successful product.
An unfortunate downside I’ve encountered over the years is the product team who wants data to dictate their strategy, perhaps by asking their data partners, “What feature should we build next?”
It’s understandable — developing new features is a resource intensive process with high stakes. This puts pressure on PMs to make the right calls, which often creates an existential need for some level of certainty, or at least defensible justification. But the analyst is only armed with data on past experiments and decisions, not the counterfactuals that might allow them to extrapolate to future decisions.

Analytics teams will produce their best work when there are clear product hypotheses to test or explore, and a set of options that might be evaluated against a well-defined outcome or success criteria.
For example, “A Discover tab will outperform a Recent Plays tab for daily engagement,” is a hypothesis that can be explored either with historical data (and some assumptions around tab usage) or a proposed experiment. On the other hand, if the question is, “Should we build a Discover tab or something else?” you might want to return to user research.
So where does that leave us?
Data teams should take the lead on (~annual) modeling exercises to explore the most important product levers that correlate with growth (i.e. customer acquisition & retention). Early efforts will come with the usual caveat, “it’s correlation, not causation” as a causal understanding of the product mechanics will be built over time and multiple iterations.
These models can be valuable guideposts for where to invest in the product, but should never be prescriptive. The bold idea that forces you to throw out the current model is likely more impactful than the one you can deduce from how the current product levers impact the business.
I’ve found this work will generate demand for more granular models, that dig into the importance of product levers within smaller products (e.g. newsletter, app) or at different stages of the customer journey.
Additionally, data teams can use this deeper, holistic understanding of the business to define a “north star metric” or the suite of “metrics that matter,” that can act as the compass for product teams as they piece together the product strategy and roadmap.
2. The basics: Tracking, reporting and post launch evaluation
The most foundational practice in product analytics is the definition of metrics, tracking and reporting that allows the product or feature to be reliably evaluated after launch. But so often data is not a first-class citizen in product launches.
In fact, data is often the last thing considered before launch, but the first thing asked for after launch.
It’s incumbent on data leaders and product leaders to make quality data integral to the launch of a product. The best product leaders I’ve worked with have the attitude of, “if we can’t measure it, then we can’t launch it.”
Ahead of a launch, the discussion typically starts with the data team asking what metrics are important to report and what user segments matter. The answer from the product team is almost invariably, “everything and everyone.”
But the best product analytics teams are part anthropologist, part engineer. They initially research the behaviors they want to study on the populations exposed to the new feature, define a clear criteria for success, and then translate these into codified outcome metrics and user segments that can be implemented. Doing the work upfront will save a lot of time on the back-end, when the executives ask whether the launch was a success.
3. Experimentation
Experimentation is the lifeblood of a product manager. With most digital product development teams shipping in an agile fashion, the ability to run experiments is generally considered “table stakes” these days.
But doing product experimentation well is far from “table stakes.” It isn’t always as simple as splitting an email campaign into control and test groups, adjusting the copy, then measuring response rates.
- The stakes are often higher — for example, user experience changes can require many days to design, build and deploy.
- There are multiple points of integration — for example, you may need to deploy your experiment allocation library via SDK or CDN, in addition to offering integration via JavaScript in the browser.
- Outcomes are less immediately known — for example, a recommendation system might need to be measured based on how it affects user engagement and retention over many weeks or months, rather than its clickability.
- The trade-offs can be more complex — for example, a home page experiment may require measurement of multiple business outcomes, each with different value to the business and different sets of stakeholders to manage.
- The methods may vary based on the type of product — for example, you may use discrete (A/B and multivariate) or adaptive (“bandit”) modes of experimentation, depending on the shape of the optimization problem at hand.
For these reasons, it’s beneficial for data leaders to proactively standardize the platform or tools to support product experimentation. This is especially the case when the execution of experiments will likely be decentralized across many cross-functional product teams.
Don’t assume you can buy or build the platform to support all use cases. But have a clear set of use cases that the platform will support, and sufficient flexibility in implementation and data collection to allow for less common or more complex experiments to be reliably delivered.

Experimentation velocity is often prized by the product teams as the key to building and scaling successful products, often epitomized by Google’s (seriously flawed) “41 shades of blue” experiment.
But while velocity and iterative learning is critical, you can’t iterate your way to a new business model. Too often experiments in large organizations are constrained by what is possible in the current user experience and / or what is controllable by a single product team, while the task at hand might be to reimagine what the experience could be.
That’s why the data team should also drive best practices for experiment design and analysis, such as:
- Lead with behavioral hypotheses rather than variations of product features
- Translate hypotheses into independent experiment attributes (and maybe leave the shade of blue up to the design team)
- Consider the right experiment design — is it a series of consecutive A/B tests or does it require a multivariate approach, such that you can understand interactions between experiment attributes?
Don’t get caught in a local maximum. The most impactful experiments I’ve seen over the last 15 years have required teams to think beyond their own scope and define hypotheses that fundamentally alter the user experience and business model.
4. Cohort analysis
Just behind running controlled experiments, cohort analysis is the next most useful analytical tool for product teams. This method involves dividing users into groups with common characteristics as a means to evaluate user health and develop product hypotheses.
There’s no one right way to do cohort analysis — the possibilities are endless — but there are many ways to get it wrong. I’ll explain a few ways I’ve seen this technique misused, and how to do it right.
First, let’s consider a product team seeking to understand the health of their user base, and whether the product experience is getting “stickier” over time.
Here, “health” may be defined by user retention, a more specific level of active engagement, or perhaps a user’s transition to a paying customer.
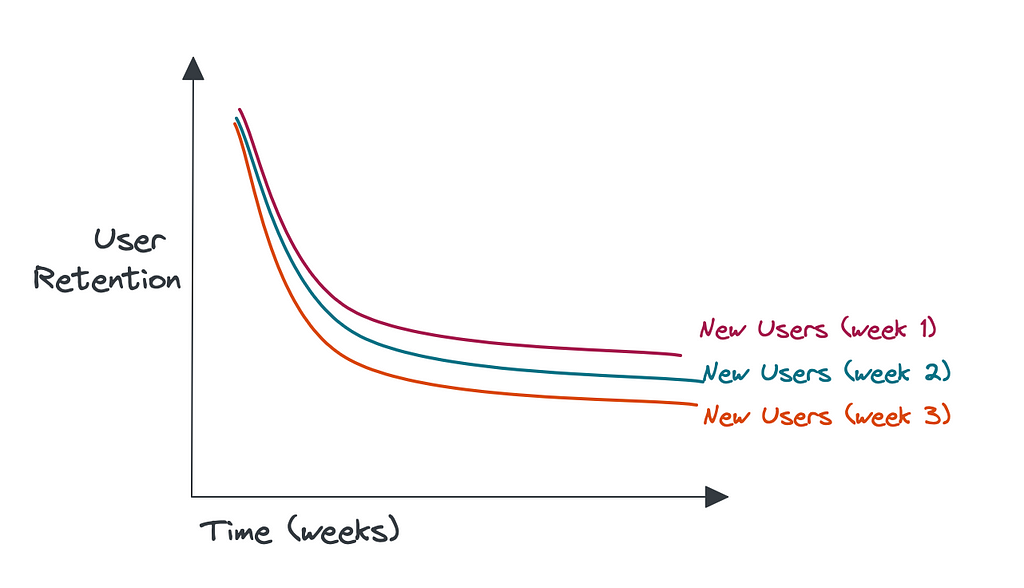
Avoid a loose definition of the cohort, such as comparing all users of your app week-by-week, where you are likely to cloud the analysis with return users in different proportions within each cohort.
For this analysis to be useful, it’s critical that you are comparing apples with apples, such as focusing on new users arriving each week. You might further segment these cohorts (e.g. based on geography or device) in order to diagnose increases and decreases in user health.
Second, let’s consider a product team seeking to understand which features are the most valuable in driving healthy users.
Avoid returning with an analysis that says “people that do x are more likely to retain.” These statements are practically useless for a few reasons.
Firstly, users that perform any action are bound to be more likely to retain — you may just be cherry-picking; secondly, you are not providing any context on the feature’s usage — it could be the most unpopular feature ever; finally, the lack of temporal awareness makes it more likely that the statement is purely correlative.
Instead, you should:
- Time-box the cohort actions (e.g. first 30 days) to separate potential cause from subsequent effect (e.g. day 30-to-180)
- Compare many actions so as not to cherry-pick features of interest
- Provide context around the feature’s usage along with its impact on user retention
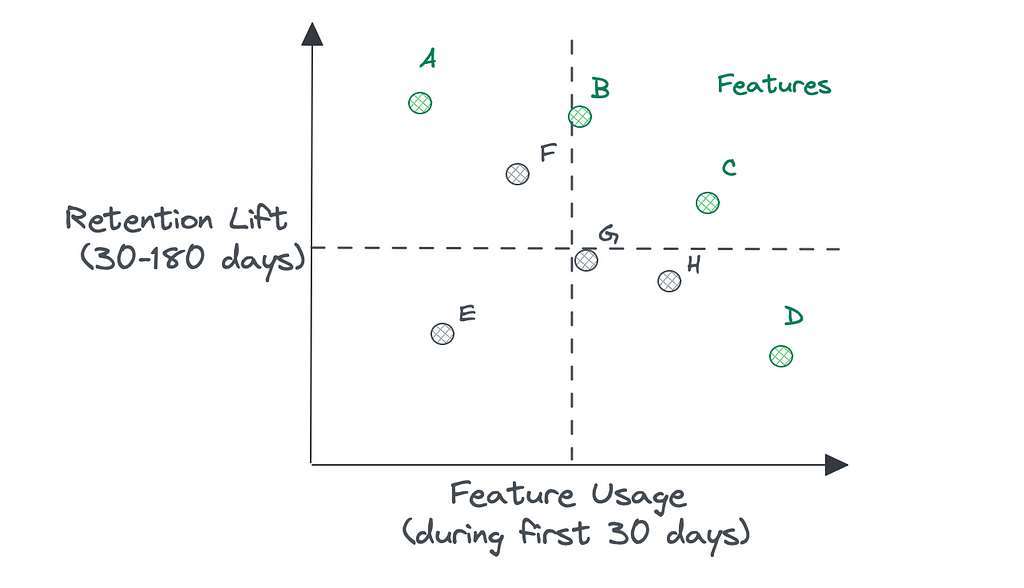
The Feature Scatterplot (above) plots Feature Usage by Retention Lift for a set of product features labeled A through H. For example, Features A is lightly adopted but correlates to the largest subsequent lift on retention; Feature D is heavily adopted but correlates with a much smaller lift on retention.
While this analysis does not prescribe where to invest, it can inform future product development:
- You might sunset feature E due to its lack of adoption and impact on retention
- You might choose to drive more adoption of high impact features A, B or F
- You might choose to rebuild a feature that is underperforming its potential adoption or impact
Product analytics tools, such as Amplitude and Mixpanel, have made easy cohorting their bread-and-butter, provided you’ve gone through the upfront implementation. But you may also choose to build it yourself within a BI tool or custom app, starting with basic behavioral cohorting then adding in dimensions to support more exploration.
5. Self-serve access to data
Across all of the above product data needs you face a common question — how do we make this self-serve?
While data teams have become increasingly agile, product teams expect the answers to seemingly straightforward questions (e.g. “how does retention differ for users who interacted with push alerts?”) at their fingertips, even if no one has pondered that specific question before.
Also, analytical work still carries an expectation of do-it-yourself, in a way that design or engineering do not. While tempting to write-off our product stakeholders as not understanding our field, it’s very often because analysts are stuck responding to rudimentary questions that could be addressed with better access to high-quality data, rather than spending time on more sophisticated, thorough, or profound analysis that clearly demonstrates their expertise.
The problem then for data teams to solve is how to invest in the right self-serve access for their product stakeholders, in order to accomplish:
- Broader access to trustworthy data, for making good decisions faster
- A shift in analyst work away from service-oriented responses, and towards a data insights roadmap
Time spent on instrumentation and access is usually well-spent, but the pay-off in terms of self-serve use must be greater than the effort spent to build and maintain it. You may find that building self-serve for basic metric access makes a lot of sense, but the further you push towards more fine-grained or sophisticated analysis, the juice is only worth the squeeze if you can generalize the solution and drive significant adoption across many product teams.
You can take multiple paths to delivering these capabilities — from off-the-shelf to homegrown and somewhere in between. Data teams will want to maintain a single source of truth in their warehouse, in order to minimize the cost to govern and maintain trust in the data. But today’s stack requires a range of tools to deliver on the self-serve promise — BI, product analytics and experimentation are often separate tools worth investing in for their tailored UIs.
Tips for success in working with product teams
With product teams becoming increasingly data-minded, and data teams becoming increasingly product-minded, the relationship between data and product disciplines can easily become complex or fraught.
But it doesn’t have to be — this is a pivotal partnership that can hum if you set product teams up for success with the right expectations on what data can bring to the table. Here’s how.
Channel their energy — Product managers are rewarded for driving impact, and the path most traveled is through narrowly focusing the product-engineering team and using experimentation to deliver incremental product improvements.
The analyst or data scientists should become product’s expert partner, ensuring the quality of experiment design, flawless execution, and rigorous interpretation of experiment data. Analysts in these experiment-driven product teams commonly earn a seat at the table, as a strategic partner who will contribute hypotheses, weigh in on the product roadmap, and calibrate the team’s compass on when they should use data versus when they might rely on instincts or qualitative methods.
The experiments won’t all be ground-breaking, but momentum is a necessary attribute of a successful product team.
Elevate the strategy with a curious data team — While it’s critical analysts become an expert partner in support of each product team’s goals, a unique strength of a strong, collaborative data team is their ability to observe overlaps, gaps and trade-offs across many product teams.
A collaborative team of analysts will see the overlap in metrics and reporting across disconnected product teams, and can build the analytical data product that no one realized they needed.
Or, they might observe a gap in the metrics used to understand user behavior, then research and implement a new set of metrics to better encapsulate the behaviors that drive the product strategy.For example, a data scientist with visibility across product teams might factor multiple outcomes into their targeting or recommendation algorithms, such as balancing short-term growth versus long-term engagement.
Cultivate a culture that encourages curiosity and critical thinking across the data team, such that analysts and data scientists can challenge the status quo and make an impact outside of the immediate direction of their product partners.
There will always be tradeoffs — There is no free lunch. When you optimize for one behavior, by definition, you are discouraging others. The more ambitious the experiment, the more stakeholders will need to be at the table and the longer the trial.
Experiments on product home pages are often where these complexities emerge, and where you might expect to run a long experiment on a very small fraction of users (e.g. <1%).
Understand the stakeholders and their objectives, define success criteria upfront (e.g. how will you value different outcomes related to browsing, navigating, and purchase) and expect to present a range of solutions that allow the product team to make trade-offs.
Embed data team members for speed, but maintain a strong core — Product teams are data hungry, experimentation happy, and feel the need for speed. As a result, most data teams will find it helpful to leverage a decentralized approach and embed data analysts to increase proximity to the product teams, avoid bottlenecks and increase velocity.
However, I recommend only doing so once:
- The data platform is sufficiently mature, in terms of the tools & processes that enable productive analytical work (and similarly, data science / ML work)
- The data team has a sufficient bench to embed directors / managers as well as individual contributors, such that you can manage in a distributed model while continue to build a stronger core (or “center of excellence”)
- The product organization has clear and distinct objectives, else your analysts’ work will overlap at best and be meaningless at worst
Another challenge to consider is once you start embedding analysts across each product team, you shift the management of critical data products that enable those teams. You can inadvertently create a silo and miss the ability to produce analysis or data products that benefit multiple product teams.
There are synergies that can be captured with a shared platform and services. Questions may arise around chargeback models, the complexity of which is best avoided unless the situation on the ground forces your hand (widely divergent costs across teams).
Enable self-serve clickstream data, but don’t expect a panacea — One of the key decisions data teams will need to make is how they treat their clickstream data, which plays a pivotal role as connective tissue between disparate data sources to understand user behavior.
This decision is rarely an easy one — while customers of the data team often say they want access to raw data, they usually mean they want access to highly curated, trustworthy data delivered in a way they can easily manipulate.
Self-serve solutions (e.g. Amplitude, Mixpanel) provide many of the out-of-the-box visualizations and downloadable reports that your product customers desperately want, but will require you to adhere to their data model and result in significantly greater investment from the data team in instrumentation, governance, training and support for the chosen tool.
On the other hand, building up product-centered reporting on top of your warehouse, via BI tools or more custom-built data apps, may offer data teams the consistency and flexibility they want, but often requires development for each new metric, report or screen.
Whichever path you choose, it should ultimately be aimed towards better or faster product decisions. And so you should factor in both the benefit of broader access, and the shift in workload of the data team from adopting this solution. A good, lightweight implementation of self-service will free up your analysts to take on more meaningful work.
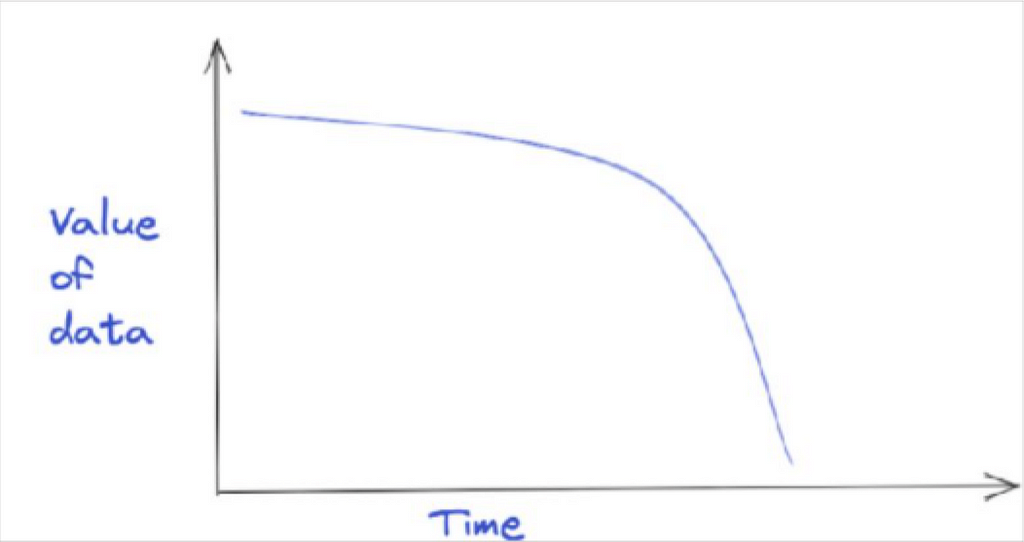
The other defining characteristic to keep in mind regarding clickstream data is its fleeting value. Fundamental changes in products and markets make gleaning insights from trends in five year old clickstream data a near-worthless exercise. Some have suggested the time decay can be expressed as aggressively as 1/x. The takeaway here is that you can often leave it behind in cold storage (if you keep it at all) during a migration or other data reorganization project.
“Real artists ship”
The famous Steve Jobs quote is an apt summary of an effective data-product team relationship. At its best, both teams are working collaboratively to ship new effective features and products guided by the best data driven decisions… and some artistic intuition.
Follow me on Medium for more stories on data leadership, applications of data science, and related topics. Subscribe to get my stories delivered to your inbox.
Meaningful Experimentation: 5 Impactful Data Projects To Help Build Better Products was originally published in Towards Data Science on Medium, where people are continuing the conversation by highlighting and responding to this story.
...