

 800+ IT
News
als RSS Feed abonnieren
800+ IT
News
als RSS Feed abonnieren📚 Share your Jupyter Notebooks like a pro
💡 Newskategorie: Programmierung
🔗 Quelle: dev.to
Are you doing data analysis with Jupyter Notebook? Here is how to create beautiful notebooks with interactive plots and host them as HTML on GitHub Pages.
I recently published an in-depth analysis of the top tags on dev.to:

dev.to is for webdevs and beginners - I have data to prove it
An in-depth data analysis of the trending articles and tags (count, reactions, comments) on dev.to.
 blog.derlin.ch
To back it up, I published the full analysis notebooks on GitHub Pages:
⮕ ✨ https://derlin.github.io/dev.to-is-for-web-devs-and-beginners/ ✨ (analysis.html is the main notebook)
If you visit the link above, you should see that:
The notebooks are available as responsive, mobile-friendly HTML pages
All the graphs are interactive: you can zoom and pan, view details on hover, export as a PNG, etc.
Some plots from the main notebook, analysis.html, are also available as standalone pages, for example, plot_articles.html
The root of the website contains an index of all the available files
(hidden, but trust me) The website is updated automatically on every push to the repository's
mainbranch.
Let's see how you can do the same!
Table of Contents
- Preface: about Jupyter Notebook
-
Interactive plots: matplotlib → plotly
- What is Plotly
- Setting up Plotly
- Plotting with Plotly
-
Other tips to make your notebook shine
- Display Pandas DataFrame with style
- Use alternate visualizations and rich content
-
Exporting notebooks to HTML
- Using nbconvert
- Adding custom styles
- Exporting specific plots to standalone HTML pages
-
Free and automated hosting on GitHub Pages with GitHub Actions
- Prerequisites
- Repository structure
- The manual process
- The workflow
- What about the directory listing?
- The final workflow
-
Going further
- Dash
- Mercury
Table of Contents generated with bitdowntoc! Read more in this article: Finally a clean and easy way to add Table of Contents to dev.to articles 🤩
Preface: about Jupyter Notebook
Jupyter Notebook is a powerful tool for interactively developing and presenting data science projects.
In short, a notebook is a single document where you can have code interspersed with their output, and also other media such as rich text, HTML, images, math equations, etc. If this doesn't ring a bell, have a look at https://www.dataquest.io/blog/jupyter-notebook-tutorial/.
There are lots of ways to install Jupyter Notebook, for example using JupyterLab or voila. I personally prefer the standalone, more lightweight version:
pip install notebook
jupyter notebook
  Serving notebooks from local directory: ...
  Jupyter Notebook 6.5.2 is running at:
   http://localhost:8888/?token=...
This command starts a local web server where you can work on your notebooks.
Interactive plots: matplotlib → plotly
There are many plotting libraries for Python, the most well-known being matplotlib and its pyplot submodule. If you have followed a data sciences tutorial, chances are you have heard of it.
Matplotlib, however, generates plots as static images, and to be honest, I find the default styles quite unappealing: https://matplotlib.org/stable/gallery/style_sheets/style_sheets_reference.html.
This is why a switched to plotly years ago.
What is Plotly
Available in multiple languages (JavaScript, R, F#, Julia, and more), Plotly's graphing library makes fully interactive, publication-quality graphs. It comes with support for line plots, scatter plots, area charts, bar charts, error bars, box plots, histograms, heatmaps, subplots, multiple-axes, polar charts, bubble charts, and more. Cherries on the cake, it is free and open source 😉.
Plotly comes with a plotly.express submodule (usually imported as px) that you can use to generate plots from arrays or pandas DataFrame / Serie objects in a single command. If you need more control over the plot, you can switch to the plotly.graph_objects submodule, which is more low-level, and thus more powerful. I personally use both, depending on my needs.
It can be installed easily using pip:
pip install plotly
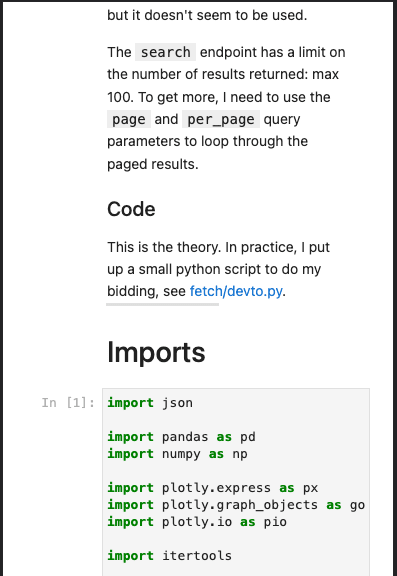
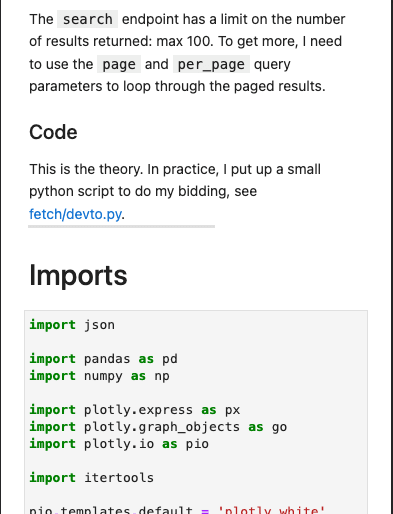
Setting up Plotly
Let's first import some Plotly submodules:
# The easiest way to make Plotly plots:
import plotly.express as px
# Lower-level interface (if you want to test it):
import plotly.graph_objects as go
# For configuration (keep reading ;):
import plotly.io as pio
The default template (aka style) is quite good already, but I personally prefer the white theme (see templates). To make it the default:
pio.templates.default = 'plotly_white'
Plotly supports displaying figures in a variety of contexts. To do so, it uses something called the renderers framework. By default, Plotly attempts to autodetect an appropriate renderer at startup, but I had some surprises, especially during export. This is why I always explicitly set the default renderer:
# Let plotly know it runs inside a Jupyter Notebook
pio.renderers.default = 'notebook'
If you edit your notebooks using other means, feel free to choose another renderer. At the time of writing, here are the available options:
print(pio.renderers)

Renderers configuration
-----------------------
    Default renderer: 'notebook'
    Available renderers:
        ['plotly_mimetype', 'jupyterlab', 'nteract', 'vscode',
         'notebook', 'notebook_connected', 'kaggle', 'azure', 'colab',
         'cocalc', 'databricks', 'json', 'png', 'jpeg', 'jpg', 'svg',
         'pdf', 'browser', 'firefox', 'chrome', 'chromium', 'iframe',
         'iframe_connected', 'sphinx_gallery', 'sphinx_gallery_png']
We are all set. So let's create plots!
Plotting with Plotly
(I assume you are familiar with pandas and numpy. If this is not the case, check out Pandas: getting started and numpy: learn.
First, we need some random data:
import pandas as pd
import numpy as np

s = pd.Series(np.random.randn(100))
s.head()
0    1.292833
1    0.999066
2    1.335286
3   -0.657893
4    1.143734
dtype: float64
Let's plot this meaningful (😜) Series using plotly.express:
px.line(s)

(This is a screenshot, but you can see the zoom/pan/drag, etc options on the top right, and the hover tooltip on a datapoint. For a real interactive plot, see plot_articles.html).
This looks good already, but there is always room for improvement. Let's customize a bit this plot:
fig = px.line(s)

fig.update_traces(dict(
    # Add the markers (dots)
    mode='lines+markers',
    # Customize the hover box
    # Use %{} to get the data value (supports formatting)
    # The empty <extra></extra> tag removes the part
    # of the hover displaying the trace name (variable: 0 above).
    hovertemplate='%{x} → %{y:.2f}<br>Nice hu?<extra></extra>'
))

fig.update_layout(
    title='Sample data',
    showlegend=False,
    yaxis=dict(title=None),
    xaxis=dict(title=None, tickmode='linear', dtick=5),
    margin=dict(l=0, b=0),
)
This gives us:

And this is only the tip of the iceberg. You can spend hours just playing with all the options!
Other tips to make your notebook shine
Display Pandas DataFrame with style
Did you know that pandas provides methods to format and style a DataFrame? This is awesome when you want to make a table more appealing or highlight certain parts to convey information quickly.
Styling is controlled via the style attribute. Here is a simple example:
df.style
  .hide('index') # do not show the index
  .highlight_max(axis=0) # highlight the max value on each line

To learn more and play with styles, have a look at Essential Techniques to Style Pandas DataFrames on Kaggle.
Use alternate visualizations and rich content
Do not hesitate to fall back to other types of representations to spice up your notebooks, for example, show a WordCloud (I used it for the cover image of my article on dev.to tags). You can also embed rich content (audio, video, iframes, SVG, etc) thanks to the IPython.display module.
Exporting notebooks to HTML
Now that we have a nice notebook with interactive plots, how do we export it to HTML and keep the interactive parts?
Using nbconvert
We can use nbconvert to export to HTML:
jupyter nbconvert *.ipynb --to html
As long as the proper renderer is set (pio.renderers.default = 'notebook'), this results in a very decent interactive webpage. On mobile, however, the responsiveness is a bit broken due to the cell numbering:
Fortunately, Jupyter allows for custom styles, so we can fix it with a tiny bit of CSS.
Adding custom styles
To fix the responsiveness issue on mobile, create a jupyter folder with the following structure:
jupyter
├── custom
│   └── custom.css
In the custom.css stylesheet, add:
/**
For this file to be processed by jupyter,
ensure you export JUPYTER_CONFIG_DIR, for example:
  JUPYTER_CONFIG_DIR=jupyter jupyter nbconvert --to html
*/

/** Make jupyter HTML export more responsive. */
@media (max-width: 600px) {
    .jp-InputPrompt.jp-InputArea-prompt,
    .jp-OutputPrompt.jp-OutputArea-prompt {
        display: none !important;
    }
}
Finally, ask Jupyter to add this custom stylesheet to all the HTML notebooks it converts by setting the JUPYTER_CONFIG_DIR before running nbconvert:
JUPYTER_CONFIG_DIR=./jupyter jupyter nbconvert *.ipynb --to html
The HTML page is now decent on mobile too:
Exporting specific plots to standalone HTML pages
I talked about notebooks, but what about specific plots?
Once we have a plotly Figure, exporting it to HTML is as easy as calling:
fig = px.line(...) # or fig = go.Figure()
# ...
fig.write_html("my_plot.html")
The my_plot.html file will contain all the necessary js/css to make it interactive and responsive. Nothing more to do!
Free and automated hosting on GitHub Pages with GitHub Actions
Since notebooks are rendered as static HTML files, the easiest way to host them is using GitHub Pages.
We could easily create a branch, manually generate and push the HTML files, and ask GitHub to serve the branch on Pages. But this would be such menial work. Instead, let's use GitHub Actions to automate the whole process!
Prerequisites
For this to work, we need to enable GitHub Pages in the repository on GitHub.
We will use a brand new way of publishing to GitHub Pages: using a custom GitHub Actions workflow. This is still in beta, but it works well and will likely pass to stable soon. For more info, see the official documentation.
Go to Settings > Pages, and under Source select "GitHub Actions":

Repository structure
The next sections assume:
The notebooks are in one folder called
dataviz,There is a
requirements.txtat the root listing all the dependencies (notebook,pandas, etc.)
If you do not have this structure, you may need to change parts of the workflow. It shouldn't be difficult, let me know in the comments if you need some help.
The manual process
Without GitHub Actions, here is how the manual process would look like:
# 0. setup python + environment + clone the repo

# 1. execute and convert notebooks
export JUPYTER_CONFIG_DIR=./jupyter
jupyter nbconvert dataviz/*.ipynb --execute --to html

# 2. copy all the HTML files into a new, empty folder
mkdir public
cp dataviz/*.html public

# 3. create an index.html with a directory listing
tree -H '.' -L 1 --noreport --charset utf-8 -o index.html

# 4. run a static server serving public
python -m http.server 8080 --directory public
The workflow
First, we need to declare a workflow that is triggered on every push to main.
name: Publish Notebooks to Github Pages
on:
  push:
    branches:
      - main
📘 SIDE NOTE 📘 If like me your repository contains more than notebook(s)+data, you can avoid re-publishing when nothing changed on the notebook(s) by adding an on.push.paths filter:
When using the
pushandpull_requestevents, you can configure a workflow to run based on what file paths are changed [...] If at least one path matches a pattern in thepathsfilter, the workflow runs.
This is the filter I use in my repo:
name: Publish Notebooks to Github Pages
on:
  push:
    branches:
      - main
    paths:
       # run only when ...
       # ... the notebooks changed
       - 'dataviz/*.ipynb'
       # ... the data used in the notebooks changed
       - '*.json'
       # ... I modified something in the workflow
       - '.github/**'
Next, we need a job that exports the notebooks to HTML.
Since we are using jupyter commands, we need to setup python and install the dependencies using pip. We then run the nbconvert command and gather all the HTML outputs into a folder - called public in the workflow to follow best practices, but the name doesn't really matter.
The final steps are to call actions/configure-pages and actions/upload-pages-artifact, which are brand new official actions to publish to GitHub Pages (documentation):
jobs:
  build:
    runs-on: ubuntu-latest
    steps:
      - uses: actions/checkout@v2

      - uses: actions/setup-python@v2
        with:
          python-version: '3.10'
          cache: 'pip' # will run faster with a cache

      - name: Install requirements
        run: pip install -r requirements.txt

      - name: Export notebooks
        run: |
          export JUPYTER_CONFIG_DIR=./jupyter
          jupyter nbconvert dataviz/*.ipynb --execute --to html

      - name: Prepare public folder
        id: folder # ← to reference the output of this step later
        run: |
          mkdir public
          cp dataviz/*.html public
          echo "name=public" >> $GITHUB_OUTPUT

      - name: Setup Pages
        id: pages # ← used in the deploy job (keep reading)
        uses: actions/configure-pages@v2

      - name: Upload artifact
        uses: actions/upload-pages-artifact@v1
        with:
          path: ${{ steps.folder.outputs.name }}
Note that if we have used fig.write_html(...) in our notebooks, the standalone plots will also be published. Why? Thanks to the --execute argument passed to nbconvert. This asks Jupyter to run the notebook before the conversion, which has some nice side effects:
it ensures the code cell numberings will always be consistent, and
it makes the job fail if you committed a faulty notebook.
Once the artifact with all the HTML files is uploaded, the only missing piece is to publish it to GitHub Pages using the actions/deploy-pages. This is done in another job, which depends on the build job. Note that it won't run if the build job fails.
jobs:
  build:
    # ... see above
  deploy:
    permissions:
      pages: write
      id-token: write

    environment:
      name: github-pages
      url: ${{ steps.deployment.outputs.page_url }}

    runs-on: ubuntu-latest
    needs: build
    steps:
      - name: Deploy to GitHub Pages
        uses: actions/deploy-pages@v1
That's it! We now have a fully automated process for publishing our notebooks on the web.
What about the directory listing?
The only problem with the workflow above is that unless you have a notebook called index.html hitting https://<username>.github.io/<repo> yields a 404 Not Found. Hugh.
To avoid this, let's serve a listing of all the HTML files available using the community action jayanta525/github-pages-directory-listing. Simply add the following between the "prepare public folder" and "setup pages" actions:
- name: Prepare public folder
  # ...

# ↓↓ add this
- name: Generate Directory Listings
  uses: jayanta525/github-pages-directory-listing@v2.0.0
  with:
    FOLDER: ${{ steps.folder.outputs.name }}

- name: Setup Pages
  # ...
This action lists all the files inside FOLDER and generates a static index.html file allowing navigation. The result can be seen at https://derlin.github.io/dev.to-is-for-web-devs-and-beginners/.
The final workflow
The full workflow is available at https://github.com/derlin/dev.to-is-for-web-devs-and-beginners/blob/main/.github/workflows/ghpages.yaml. Use this link to see the version at the time of writing.
You may have to adapt it a bit to fit your needs, but I hope it provides a strong base to build from.
Going further
This article shows a way to share a notebook in a static form. If you want to go further and make the notebook(s) truly interactive, here are some links to check out. Remember, however, that they all require a Python server running (no easy/free hosting).
Dash
Through a couple of simple patterns, Dash abstracts away all of the technologies and protocols that are required to build a full-stack web app with interactive data visualization.
Have a look at their gallery https://dash.gallery/Portal/. I used it a while back and enjoyed the experience.
Mercury
https://mercury-docs.readthedocs.io/en/latest/
Mercury is a perfect tool to convert Python notebook into a web app and share with non-programmers.
You define interactive widgets for your notebook with the YAML header.
Your users can change the values of the widgets, execute the notebook and save the result (as HTML file).
You can hide your code to not scare your (non-coding) collaborators.
Easily deploy to any server.
Never tried it, but seems interesting. Let me know!
...