

 800+ IT
News
als RSS Feed abonnieren
800+ IT
News
als RSS Feed abonnieren📚 Mean Absolute Log Error (MALE): A Better Relative Performance Metric
💡 Newskategorie: AI Nachrichten
🔗 Quelle: towardsdatascience.com
Mean Absolute Log Error (MALE): A Better “Relative” Performance Metric
Introducing the MAE and MSE of “relative” performance metrics
In the forecasting world, and the ML and Statistics worlds more generally, performance metrics play a critical role.
They’re used during model fitting, hyperparameter tuning and model selection to find the best possible model for your data; and they are used to understand and explain how well your model predicts the future, in absolute terms.
In this post, my aim is to convince you that for many forecasting¹ problems, you should measure model performance using the Mean Absolute Log Error (MALE) or the closely related Root Mean Square Log Error (RMSLE).
Just as the MAE and RMSE use the “raw” distance between forecasts and true values, the MALE and RMSLE use the “relative” (log) distance; you can think of the MALE and RMSLE as the MAE and RMSE of “relative” metrics.
In fact, I’m confident I can persuade you that these metrics are not only the best choice, but that they’re the obvious choice in many situations.
Before I explain why, let’s quickly review what problem performance metrics solve, and where the existing metrics are lacking.
The Problem
Error measures and performance metrics
First, let’s distinguish between two closely related concepts: error measures and performance metrics.
An error measure (or just error) tells you how “far” a forecast f is from the observed value y. Examples are the “raw” error RE = f — y and the percentage error PE = (f — y) / y.
By contrast, a performance metric (or just metric) uses an error measure to tell you how good some model (or set of forecasts) is overall. One example is the MSE, which takes the mean of the squared “raw” error over all points in your data set:
https://medium.com/media/6abdd2e0046e80637124975e1994bea3/hrefWhat are they good for?
Error measures and performance metrics are used during model fitting, as part of the model’s loss function; during model tuning, in order to select appropriate hyperparameters for the model; and during model selection, where they’re used to select the best model type. They play a big role in determining the final model you end up with, so it’s important that they capture what you care about.
They’re also used when trying to understand and explain the performance of a model: for example in statements like “we can predict next quarters’ sales with an average error of 15%”. So they also need to be interpretable.
So far, so obvious (hopefully). These concepts will come in handy later.
Strictly positive data and relative errors
As I will discuss in another post (coming soon!), different forecast metrics are appropriate in different situations.
For example, if you care about errors measured in percent (and your data are strictly positive) then “relative” metrics such as the MAPE or sMAPE are often recommended; if you care about errors measured in real units (e.g. number of apples), or your data can be zero or negative, then “raw” metrics such as MAE or MSE are more appropriate.
If you want to compare or aggregate performance metrics across time series, then you might want to use scaled metrics [1].
In this post I’ll focus on metrics for a particular type of problem. Specifically, one where:
- The data are strictly positive: they do not take zero or negative values.
- The forecaster (i.e., you!) cares about relative rather than raw errors².
While many forecasting problems are of this type, not all are — it’s important to choose an appropriate metric for your problem.
Current Solutions
What errors do forecasters use?
Gneiting [2] found that the mean absolute percentage error (MAPE) was the most widely used measure of forecast accuracy in businesses and organizations, as of the mid 2000s.
Looking at popular statistical forecasting packages — for example the “fable” package in R, or the “gluonts” package in Python — suggests that the MAPE (and its friend the sMAPE) are still the main “relative” performance metrics used in practical forecasting applications.
The MAPE is popular because it can handle data where the scale varies over time; it is relatively comparable across time series; deals reasonably well with outliers; and has a simple interpretation.
However, the MAPE and sMAPE have problems — let’s see what they are.
Problems with the MAPE
What’s the problem with the MAPE?
Well, as its name indicates, the MAPE uses the percentage error as its error measure:
https://medium.com/media/2df55c6348b114a838048148998f1b4e/hrefThis error measure is notorious for punishing overestimates more than underestimates.
As an extreme example, if you overestimate the observed value by 10x, you get an absolute percentage error (APE = |PE|) of 10; whereas if you underestimate it by 10x, you get an APE of only 0.9 — less than 1/10th the error!
This is a smaller problem (but still a problem) in more realistic cases, where your forecasts are closer to the truth.
Another way to look at the PE’s problem is that errors from underestimates are squished into the range from -1 to 0 (i.e. -100% to 0%), whereas errors from overestimates can take any value from 0 to infinity.
Problems with the sMAPE
A proposed solution to this underestimation problem is the symmetric MAPE (sMAPE), which instead uses the “symmetric percentage error” error measure:
https://medium.com/media/13a3d25eb24cb99b06fd5257e5f19201/hrefThe sPE squishes the error of overestimates so they are on the same scale as the errors from of underestimates; this means underestimates and overestimates are punished equally harshly.
But while the sMAPE successfully solves the “underestimation” problem, it creates two other problems³:
- The metric is now more difficult to interpret.
- Since sPE errors are bounded, it won’t tell you about extreme outliers in your data. (This can be a feature or a bug, depending on your point of view.)
(Sub)Optimal models
Last, let’s think a bit about what the MAPE and sMAPE optimize for.
As a reminder, when you optimize a model using the MAE or MSE, your model will end up predicting the median or mean of the distribution, respectively⁴. (Provided you have enough data and a good enough model.)
By contrast, when you optimize for the MAPE or sMAPE, your model ends up predicting… nothing in particular.
That is, what quantity your model ends up predicting will depend on the distribution of your target y, but it won’t (generally) be the mean or median of the distribution.
This behaviour is not particularly nice. Can we do better?
Log Error
Better error measures…
We’ve seen that the problems of the MAPE and sMAPE come from their error measures — the percentage error (PE) and the symmetric percentage error (sPE).
Can we find a better way to measure relative error between forecasts f and observed values y? (Maybe something analogous to the “raw” error f — y used by the MAE and MSE?)
My solution⁵ is the Log Error (LE):
https://medium.com/media/f752a0ac6b8d131238c32e6e1a00219a/hrefIn words, it is the difference between the log of the forecast and observed values⁶— or equivalently, the log of the ratio between the forecast and observed values⁷. It’s closely related to the percentage error: LE = log(1 + PE).
This error measure has a number of nice properties:
- It is zero if and only if the forecast is exactly correct (f = y).
- Underestimates and overestimates are punished equally harshly: for example, the absolute log error (ALE = |LE|) for underestimating y by 2x is the same as for overestimating y by 2x.
- Errors add⁸: in math, LE(x, y) + LE(y, z) = LE(x, z). This distinguishes it from the PE and sPE, and makes the LE look like the “raw” error measure used by the MSE and MAE.
One way to think about the LE is that it solves the problems of the PE and the sPE by stretching error underestimates and squishing error overestimates onto the full real line (-∞, ∞) using the log transformation.
Another way to think about it is as the raw error on the log scale — i.e. just the raw distance between the forecast and the observed value, on the log of the data.
And as I’ll explain later, it is closely analogous to the “raw” error measure used by the MAE and MSE.
…lead to better metrics
Now that we have a nicer relative error measure, let’s return to what we’re really interested in: performance metrics.
As for the MAPE or sMAPE, to get a metric from our error measure we take the mean of its absolute value over all our data points:
https://medium.com/media/3bc372efc34d9323d64f81620a586efd/hrefThe result is the Mean Absolute Log Error metric, or “MALE” for short.
Alternatively, we can use the square of the LE to get the Root Mean Square Log Error (RMSLE):
https://medium.com/media/3aaf187bb82de15da675395d5aafff59/hrefCompared to the MALE, this metric is more sensitive to outliers.
These metrics have a few advantages over the other “relative” metrics, which I’ll discuss below.
What they estimate
When you optimize for the MALE, you get models which predict the median of your distribution.
(Or more formally: the Bayes estimator under MALE loss is the median.)
When you use the “squared-error” version (RMSLE), you get models which predict the geometric mean of your data.
This is in contrast to the MAPE and sMAPE, which are biased in general.
Interpretability
To translate the MALE metric into something your boss will understand, you can transform it back onto a relative scale by taking the exponential, i.e.
https://medium.com/media/d975b2307b8594825e70617490253063/hrefThis gives you the (geometric) mean relative error. For example, an EMALE of 1.2 means you expect to be wrong by a factor of 1.2 in either direction, on average. (Explain this to your boss as a 20% average percentage error.)
This is an improvement over the sMAPE, which has no direct interpretation, and over the MAPE, which though technically simple can be a bit misleading⁹.
You can use the same trick for the RMSLE:
https://medium.com/media/b63f7f8ee74fb299f3806fdeee7729db/hrefLike the RMSE, this is not directly interpretable, but it gives a good sense of how large your errors will be in relative terms.
Empirical evidence
While the empirical evidence is weak on which metric performs better “in the wild”, what evidence there is weakly suggests that the MALE and RMSLE perform at least as well as the sMAPE in practice.
For example, Tofallis [3] shows that the RMSLE metric
- Produces a better model fit than the MAPE on a few example data sets. (No surprises there.)
- Outperforms the MAPE and sMAPE in a model selection task using simulated data.
Koutsandreas et al. [4] don’t find much difference between the performance of different metrics (including the MALE but not the RMSLE) for model selection. But the small differences they do find support the claim that the MALE metric tends to select accurate models.
Simplicity
The MALE and RMSLE are easy to understand, remember and code — even easier than the MAPE or sMAPE. For example, in Python:
male = mean(abs(log(f / y)))
rmsle = sqrt(mean(log(f / y)**2))
Comparing MALE to Other Metrics
MAE and MSE
If you’ve been paying attention, you might have noticed some similarities between the MAE / MSE and the MALE / RMSLE.
In fact, there is a close connection between these two sets of metrics: specifically, optimizing for the MALE (or RMSLE) is the same as optimizing for the MAE (or MSE) on the log of the data.
Perhaps this is obvious, but let’s see it explicitly for the MAE:
https://medium.com/media/23fbb38f3a46e13244c29c14bb4db187/hrefIn fact, you can think of the MAE and MALE as metrics in the same family: the only difference is that the MAE uses the raw distance between forecasts and observed values, whereas the MALE uses relative (log) distances.
What does this mean?
One implication is that for models which use MSE (or MAE) as their loss functions during training, you can optimize instead for RMSLE (or MALE) simply by taking the log of your data before training¹⁰.
(Just remember to convert back to the original scale afterwards!)
MAPE and sMAPE
All 3 of the absolute percentage error (APE), symmetric absolute percentage error (sAPE) and the absolute log error (ALE) are similar when the forecast is close to the true value, as you can see from this graph:
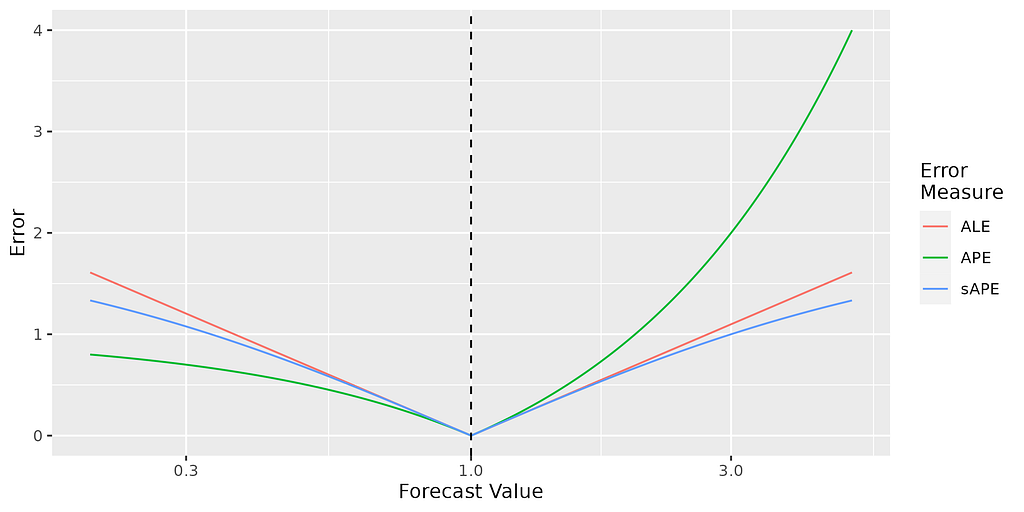
So in practice, provided your errors are sufficiently small (e.g. less than 10%), it probably doesn’t make much difference which of the MALE, sMAPE or MAPE you use.
The ALE is is between the APE and sAPE in sensitivity to outliers. For example, compared to being wrong by +10x, being wrong by +100x gives you 1.2 times your original sAPE, 2 times your original ALE, and 9 times your original APE.
Scaled metrics
Since the MALE and RMSLE are in relative units (rather than real units), they can be used to compare the performance of models across time series, or to aggregate performance metrics across different time series. (Just like other relative metrics.)
This works well when the level of noise (in relative terms) is similar between your different time series. But what if, for example, some of your series are very noisy / difficult to predict, and others not so much?
In this case, you can normalize your errors by the error of a benchmark method (e.g. the naive or seasonal naive methods) to place them on the same scale [1].
For example, the scaled log error (SLE) of a forecast for time T + h given training data for t = 1, 2, …, T is
https://medium.com/media/ffcbebbf2946fbcb85d8aec0f5394367/hrefAnd the mean absolute scaled log error is
https://medium.com/media/73124b6e57924be6e5235920c4f6946b/hrefSummary
In this post, I have argued that for certain forecasting problems, you should measure forecast errors using the Log Error (LE), rather than “raw” or percentage errors. This means measuring model performance using metrics based on the LE: specifically the Mean Absolute Log Error (MALE) and the Root Mean Square Log Error (RMSLE).
These metrics should be used only if your data are strictly positive, and you are interested in accuracy measured in relative (percent) terms and not real terms. In this case, they have the following benefits:
- They have a clear and simple interpretation.
- Optimizing for them produces estimates of the median (MALE) or geometric mean (RMSLE).
- They can be easily compared and aggregated across different time series.
- They avoid the well-known problems of the mean absolute percentage error (MAPE) and the symmetric mean absolute percentage error (sMAPE).
The MALE and RMSLE can be thought of the MAE and RMSE of “relative” performance metrics. I think they should be the default choice if you are interested in measuring errors in relative terms.
Have I persuaded you? Why / why not? Let me know in the comments.
References
[1] R. Hyndman and A. Koehler, Another look at measures of forecast accuracy (2006), International Journal of Forecasting 22(4).
[2] T. Gneiting, Making and evaluating point forecasts (2011), Journal of the American Statistical Association 106(494).
[3] C. Tofallis, A better measure of relative prediction accuracy for model selection and model estimation (2015), Journal of the Operational Research Society 66(8).
[4] D. Koutsandreas, S. Evangelos, P. Fotios and A. Vassilios, On the selection of forecasting accuracy measures (2022), Journal of the Operational Research Society 73(5).
Footnotes
- I focus on the forecasting field - because this seems to be where “relative” error metrics are currently most used - but the same arguments apply for other ML fields.
- Relative errors only really make sense when you’re talking about strictly positive data.
- It’s worth noting that typically none of these problems are too serious, and the sMAPE has been successfully applied in practice.
- More precisely, this is the optimal predictor (“Bayes estimator”) for this loss function.
- This error measure has been discussed by Tofallis [3] and others; I think the idea is obvious enough that many people must have thought of it and used it.
- Any base can be used in the logarithm; here I assume we’re using base e, i.e. the natural logarithm.
- For this reason it has also been called the “Log Accuracy Ratio”. I prefer “Log Error”, since this is shorter and makes it clear that it is an error measure.
- This property is not strictly for an error measure, but it is a nice one to have.
- In particular, a percentage error of +20% means you were wrong by a factor 1.2, whereas a percentage error of -20% means you were wrong by a factor of 1.25 (1 / 0.8). This lack of symmetry is liable to cause confusion.
- You may wonder why it’s worth defining and naming these new metrics at all, if working with them is simply equivalent to working with the MAE / RMSE on the log of your data. In my opinion, explicitly defining and naming these metrics helps you to think more clearly about what is being optimized when working with data on the log scale, as well as making this easier to communicate. (Saying “I optimized for / evaluated the MALE” is shorter and less confusing than “I optimized for / evaluated the MAE on the log of the data”.)
Mean Absolute Log Error (MALE): A Better Relative Performance Metric was originally published in Towards Data Science on Medium, where people are continuing the conversation by highlighting and responding to this story.
...