

 800+ IT
News
als RSS Feed abonnieren
800+ IT
News
als RSS Feed abonnieren📚 Top 6 tools for Node.js monitoring
💡 Newskategorie: Programmierung
🔗 Quelle: dev.to
Written by Pascal Akunne✏️
Node.js monitoring is crucial to helping maintain the stability, dependability, and performance of your applications. You can rapidly spot any problems that might be harming the performance of your app by keeping an eye on crucial indicators like resource usage, error detection, and response times.
Identifying and resolving issues before they escalate will help you avoid downtime or data loss. Monitoring your Node.js application is key to preserving its stability and health and maintaining a positive user experience.
There are a number of Node.js monitoring tools available, each with a different set of features and functionalities. In this article, we’ll introduce the top 6 tools for Node.js monitoring:
- AppMetrics
- Clinic.js
- Express Status Monitor
- PM2
- AppSignal
- Sematext
These tools are all full monitoring solutions and include real-time performance tracking, error reporting, and analysis.
Let’s dive right in!
AppMetrics
 AppMetrics is a monitoring tool for Node.js applications, providing real-time monitoring and data analysis. It allows developers to track important metrics such as response times, error rates, and resource utilization, providing valuable insights into the performance and behavior of their applications.
To install AppMetrics, run the following command:
npm install appmetrics-dash
Then, add the below code snippet to the very beginning of the primary JavaScript source file (e.g., app.js) to create a dashboard for all HTTP servers generated by your application:
require ('appmetrics-dash').attach()
By default, this will establish a new dashboard server with route /appmetrics-dash and port 3001.
The following data will be displayed in the dashboard:
- CPU profiling
- HTTP incoming requests
- HTTP throughput
- Average response times
- CPU
- Memory
- Heap
- Event loop times
- Environment
- Other requests
- HTTP outbound requests
In addition, AppMetrics enables you to build a Node.js report and Heap snapshots directly from its dashboard.
AppMetrics Pros
- Easy set up: Straightforward and user-friendly interface makes it simple to set up and begin monitoring your application
- Real-time monitoring: Enables you to spot and fix problems as they happen
- Integration: Connects with other monitoring and logging solutions, making it simple to add to your existing monitoring configuration
- Open source: AppMetrics is free software that is accessible to all developers, regardless of budget
AppMetrics Cons
- Limited features: As it’s geared to offering fundamental monitoring features, AppMetrics may not be appropriate for monitoring requirements that are more complex
- Resource overhead: App performance may be impacted by monitoring, regardless of the choice of solution. Careful consideration should be given to the amount of resources needed to conduct monitoring in a production environment
Clinic.js
 Clinic.js is a Node.js monitoring tool that offers four sub-tools to assist in identifying and resolving performance issues with Node.js applications. To use Clinic.js in your application, install the module:
npm install clinic -g
Once installed, you’ll get to choose any of the below four sub-tools to generate reports:
Clinic.js Doctor
Clinic.js Doctor identifies the root cause of the app’s performance issues. Its features include:
- Collecting metrics by injecting probes
- Assessing health and heuristics
- Creating recommendations
Clinic.js Bubbleprof
Clinic.js Bubbleprof is an entirely unique tool for profiling your Node.js code. It offers the following features:
- Collecting metrics using
async_hooks - Tracking latency between operations
- Creating bubble graphs
Clinic.js Flame
Clinic.js Flame uses flamegraphs to identify bottlenecks and hot paths in your code. Here are its features:
- Collecting metrics by CPU sampling
- Tracking top-of-stack frequency
- Creating flamegraphs
Clinic.js HeapProfiler
Clinic.js HeapProfiler uses flamegraphs to reveal memory allocations by functions. It’s features include:
- Collecting metrics of memory allocation
- Tracking top-of-stack allocations
- Creating flamegraphs
Clinic.js Pros
- Detailed analysis: Offers a thorough evaluation of Node.js application performance, highlighting slow I/O operations, functions, and more
- Open source: Clinic.js is free software that is accessible to all developers, regardless of their budget
Clinic.js Cons
- Complexity: Although intended to be user-friendly, Clinic.js can still be challenging for users who are unfamiliar with performance profiling to comprehend and utilize
- Limited features: Clinic.js is designed specifically for performance profiling, so it may lack some of the capabilities you'd expect from a full-featured monitoring tool
Express Status Monitor
 Express Status Monitor is a Node.js monitoring tool developed primarily for the Express.js framework, which is the go-to option for creating Node applications. It is an easy-to-use, self-hosted module that reports real-time server performance metrics for Express-based Node servers via a
 /status route with the aid of Socket.io and Chart.js.
Install Express Status Monitor with npm by running the following command:
npm install express-status-monitor
Next, add the below code before any other middleware or router:
app.use(require('express-status-monitor')())
Now, run your server and navigate to the /status route to monitor your Node application.
Express Status Monitor Pros
- Simple to set up: Requires no configuration and is easy to integrate into existing Express.js applications
- Lightweight: Intended to be small and lightweight; will not significantly increase application overhead
- Helps track health of application: The tool’s Status Monitor page offers important information including response times, error rates, and system utilization
- Open source: Express Status Monitor is free software that is accessible to all developers, regardless of budget
Express Status Monitor Cons
- Limited functionality: Express Status Monitor is a simple monitoring tool and does not offer as much functionality as some of the other solutions included in this article
- No alerting: Does not provide a warning when there is an issue with the application
- Not suitable for large applications: Designed for smaller Express apps; may not be appropriate for larger, more complex applications
PM2
 PM2 is a Node.js monitoring tool that enables the monitoring of Node.js application performance in production. It allows you to keep your application running forever, reload without downtime, and facilitate common system admin tasks.
With PM2, you can run applications in cluster mode. Use the following command to install the PM2 module:
npm install pm2 -g
You can daemonize your app by running the application source file (e.g., app.js), like so:
pm2 start app.js
Your application is now being monitored and will be kept running forever.
PM2 Pros
- Easy to use: Simple set up and ease of use make PM2 a good option for organizations with limited process management knowledge
- Automatic reload: Applications that crash or fail will automatically be restarted by PM2 to keep them operating and accessible
- Load balancing: PM2 enables load balancing, making it easier to divide incoming requests across many processes for increased performance and dependability
- Process monitoring: Access to real-time application status and performance data makes it easier to identify and fix problems
- Log management: Integrates with log management solutions, making it simpler to work with log data and understand applications behavior
- Open source: PM2 is free software that is accessible to all developers, regardless of budget
PM2 Cons
- Resource usage: If not setup properly, PM2 can use a lot of memory and CPU
- Complexity: Simple to use in basic applications, but can become complex and challenging to manage in more complex use cases
AppSignal
 AppSignal is another Node.js monitoring tool. It provides the following features:
- Error tracking: Provides functionality to easily track, debug, and fix errors
- Performance monitoring: Monitors the performance of your app’s slow actions down to the nanosecond
- Host monitoring: Monitors the CPU, disk, network, and other server data
- Anomaly detection: Helps avoid surprises by setting triggers for anomalies on any metric of your choice
- Metric dashboard: Collects metrics from your app’s code and displays them in a dashboard
- Uptime monitoring: Realtime alert when your application is down
To install AppSignal to your application, run the following command:
npm install --save @appsignal/nodejs
Then, create an appsignal.cjs file to require and configure AppSignal. This file may also be placed in another location, like in the src/ directory:
// appsignal.cjs
const { Appsignal } = require("@appsignal/nodejs");

new Appsignal({
  active: true,
  name: "<YOUR APPLICATION NAME>",
  pushApiKey: "<YOUR API KEY>", // Note: renamed from `apiKey` in version 2.2.5
});
Now, you can run your application like you normally would, but use the --require flag to load AppSignal's instrumentation before any other library:
node --require './appsignal.cjs' index.js
AppSignal Pros
- Easy setup: Simple to install and configure, making it accessible to organizations of all sizes and technical skill levels
- Real-time insights: Provides rapid insights into app performance and error detection, enabling issues to be identified and fixed quickly
- Integrations: Enables easy gathering of data from many sources, including well-known cloud platforms
- Comprehensive error tracking: Offers comprehensive error reports with stack traces and context information, making it simpler to identify and fix problems
AppSignal Cons
- Cost: AppSignal is a paid tool, but does offer a free 30-day trial. When compared to other performance monitoring and error tracking technologies, AppSignal might be costly, especially for larger organizations
- Limited language support: Only supports Ruby, Elixir, and Node.js applications at the time of writing
- Steep learning curve: Setting up and using the platform may be challenging for organizations that do not have prior experience with performance monitoring tools
Sematext
 Sematext is a Node.js tool that provides a platform for log analytics, infrastructure management, and performance monitoring. It offers real-time analysis of application, infrastructure, and cloud service logs and performance metrics. Additionally, it provides a centralized area for storing and analyzing log data, making it easier for teams to identify and fix problems.
To install Sematext, run the following command:
npm install spm-agent-nodejs
Then create an .env file and write the following code:
MONITORING_TOKEN=<your-monitoring-token-goes-here>
INFRA_TOKEN=<your-infra-token-goes-here>
Require it at the top of your main file, like so:
// start agent
require('spm-agent-nodejs')
Now, run the following code:
# Terminal
node app.js
Sematext Pros
- Scalable: Appropriate for usage in large-scale environments because it is made to manage massive volumes of log data
- Centralized log management: Provides a central area for storing, finding, and analyzing logs, making it easier for developers to work with log data
- Real-time monitoring: Real-time performance indicator reporting and alerting help developers promptly identify and resolve issues
Sematext Cons
- Cost: Sematext is a paid tool, but does offer a free tier. In comparison to alternative log analytics systems, Sematext might be pricey, especially for larger teams or enterprises
- High learning curve: Setting up and using the platform may be challenging, especially for organizations that have never used log analytics software
Conclusion
Maintaining the stability and performance of your Node.js application requires a robust monitoring solution. In this article, we identified six tools — AppMetric, Clinic.js, Express Status Monitor, PM2, AppSignal, and Sematext — that offer a variety of options to suit the particular requirements of your Node.js application.
The proper monitoring tool can help you rapidly identify and address any problems, improving user experience and enhancing app reliability.
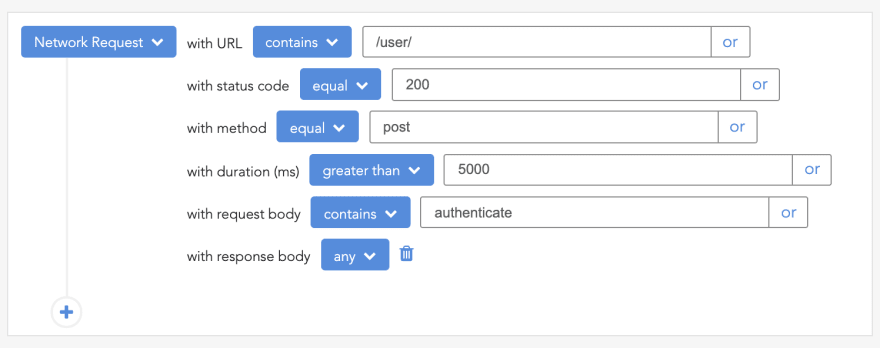
200’s only ✔️ Monitor failed and slow network requests in production
Deploying a Node-based web app or website is the easy part. Making sure your Node instance continues to serve resources to your app is where things get tougher. If you’re interested in ensuring requests to the backend or third party services are successful, try LogRocket.
LogRocket is like a DVR for web apps, recording literally everything that happens on your site. Instead of guessing why problems happen, you can aggregate and report on problematic network requests to quickly understand the root cause.
LogRocket instruments your app to record baseline performance timings such as page load time, time to first byte, slow network requests, and also logs Redux, NgRx, and Vuex actions/state. Start monitoring for free.
...