

 800+ IT
News
als RSS Feed abonnieren
800+ IT
News
als RSS Feed abonnieren📚 Collecting and analyzing memory dumps
💡 Newskategorie: Programmierung
🔗 Quelle: devblogs.microsoft.com
Building upon the diagnostics improvements introduced in .NET Core 3.1, we’ve introduced a new tool for collecting heap dumps from a running .NET Core process.
In a previous blog post we introduced, dotnet-dump, a tool to allow you to capture and analyze process dumps. Since then, we’ve been hard at work to improve the experience when working with dumps.
Two of the key improvements we’ve made to dotnet-dump are:
- We no longer require
sudofor collecting dumps on Linux dotnet dump analyzeis now a supported on Windows
GC dumps
However, one of the key limitations that remains is process dumps are not portable. It is not possible to diagnose dumps collected on Linux with Windows and vice-versa.
Many common scenarios don’t require a full process dump inspection. To enable these scenarios, we’ve introduced a new lightweight mechanism for collecting a dump that is portable. By triggering a garbage collection in the target process, we are able to stream events emitted by the garbage collector via the Existing EventPipe mechanism to regenerate a graph of object roots from those events.
These GC dumps are useful for several scenarios including:
- Comparing number of objects by type on the heap
- Analyzing object roots
- Finding what objects have a reference to what type
- Other statistical analysis about objects on the heap
dotnet-gcdump
In .NET Core 3.1, we’re introducing a new tool that allows you to capture the aforementioned process dumps for analysis in PerfView and Visual Studio.
You can install this .NET global tool by running the following command:
dotnet tool install --global dotnet-gcdump
Once you’ve installed dotnet gcdump, you can capture a GC dump by running the following command:
dotnet gcdump collect -p <target-process-PID>
Note: Collecting a gcdump triggers a full Gen 2 garbage collection in the target process and can change the performance characteristics of your application. The duration of the GC pause experienced by the applicaiton is proportional to the size of the GC heap; applications with larger heaps will experience longer pauses.
The resulting .gcdump file can be analyzed in Visual Studio and PerfView on Windows.
Analyzing GC dumps in Visual Studio
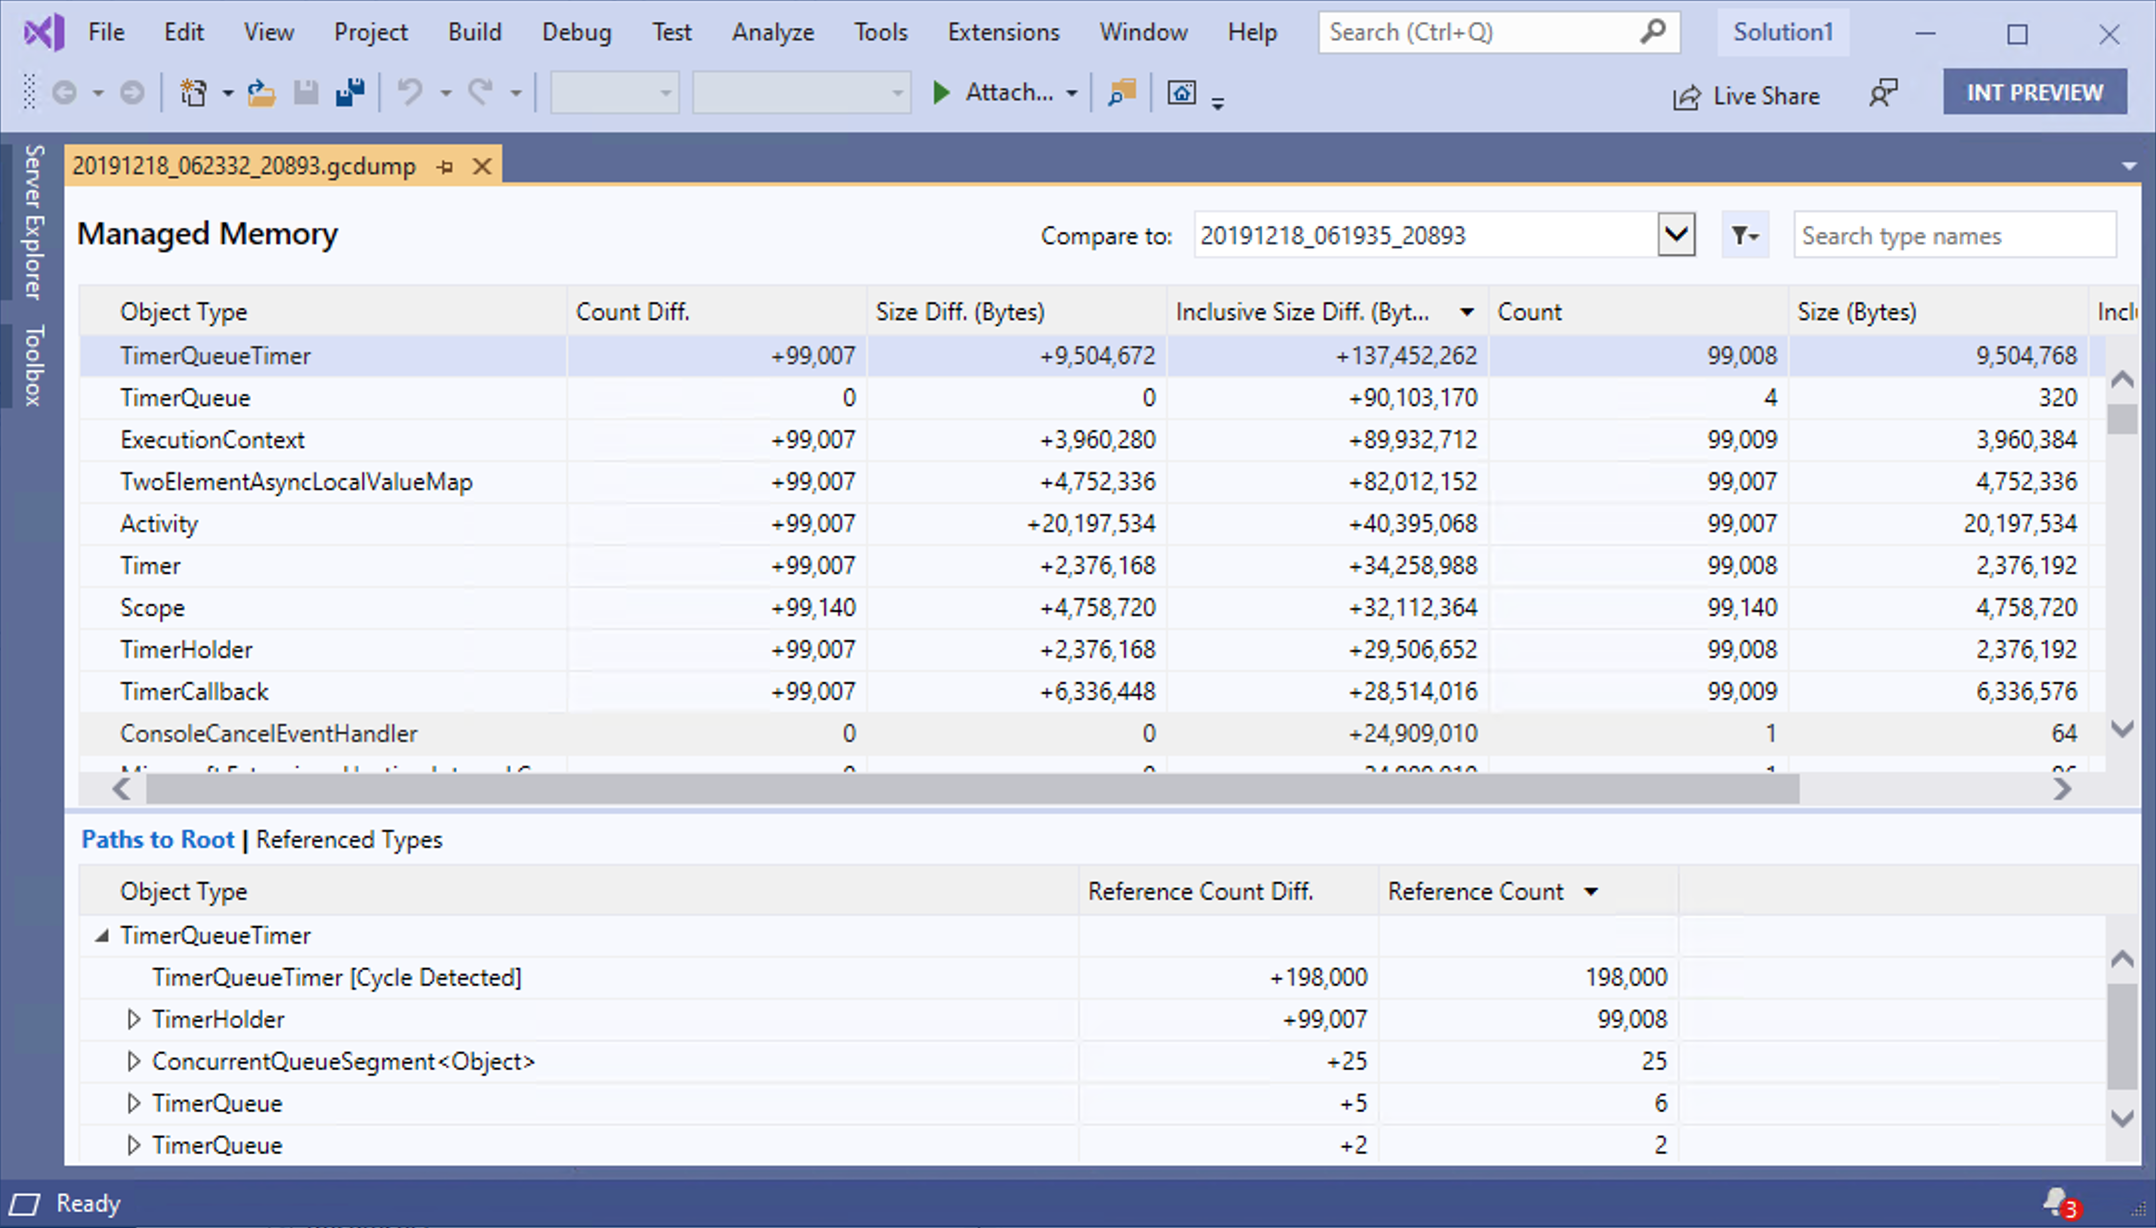
The collected GC dumps can be analyzed by opening the .gcdump files in Visual Studio. Upon opening in Visual Studio, you are greeted with the Memory Analysis Report page.

The top pane shows the count and size of the types in the snapshot, including the size of all objects that are referenced by the type (Inclusive Size).
In the bottom pane, the Paths to Root tree displays the objects that reference the type selected in the upper pane. The Referenced Types tree displays the references that are held by the type selected in the upper pane.
In addition to the memory analysis report of just a single GC dump, Visual Studio also allows you to compare two gc dumps. To view details of the difference between the current snapshot and the previous snapshot, navigate to the Compare To section of the report and select another GC dump to serve as the baseline.
Closing
Thanks for trying out the new diagnostics tools in .NET Core 3.1. Please continue to give us feedback, either in the comments or on GitHub. We are listening carefully and will continue to make changes based on your feedback.
The post Collecting and analyzing memory dumps appeared first on .NET Blog.
...