Ausnahme gefangen: SSL certificate problem: certificate is not yet valid ๐Ÿ“Œ Collecting and analyzing memory dumps

๐Ÿ  Team IT Security News

TSecurity.de ist eine Online-Plattform, die sich auf die Bereitstellung von Informationen,alle 15 Minuten neuste Nachrichten, Bildungsressourcen und Dienstleistungen rund um das Thema IT-Sicherheit spezialisiert hat.
Ob es sich um aktuelle Nachrichten, Fachartikel, Blogbeitrรคge, Webinare, Tutorials, oder Tipps & Tricks handelt, TSecurity.de bietet seinen Nutzern einen umfassenden รœberblick รผber die wichtigsten Aspekte der IT-Sicherheit in einer sich stรคndig verรคndernden digitalen Welt.

16.12.2023 - TIP: Wer den Cookie Consent Banner akzeptiert, kann z.B. von Englisch nach Deutsch รผbersetzen, erst Englisch auswรคhlen dann wieder Deutsch!

Google Android Playstore Download Button fรผr Team IT Security


๐Ÿ“š Collecting and analyzing memory dumps


๐Ÿ’ก Newskategorie: Programmierung
๐Ÿ”— Quelle: devblogs.microsoft.com

Building upon the diagnostics improvements introduced in .NET Core 3.1, weโ€™ve introduced a new tool for collecting heap dumps from a running .NET Core process.

In a previous blog post we introduced, dotnet-dump, a tool to allow you to capture and analyze process dumps. Since then, weโ€™ve been hard at work to improve the experience when working with dumps.

Two of the key improvements weโ€™ve made to dotnet-dump are:

  • We no longer require sudo for collecting dumps on Linux
  • dotnet dump analyze is now a supported on Windows

GC dumps

However, one of the key limitations that remains is process dumps are not portable. It is not possible to diagnose dumps collected on Linux with Windows and vice-versa.

Many common scenarios donโ€™t require a full process dump inspection. To enable these scenarios, weโ€™ve introduced a new lightweight mechanism for collecting a dump that is portable. By triggering a garbage collection in the target process, we are able to stream events emitted by the garbage collector via the Existing EventPipe mechanism to regenerate a graph of object roots from those events.

These GC dumps are useful for several scenarios including:

  • Comparing number of objects by type on the heap
  • Analyzing object roots
  • Finding what objects have a reference to what type
  • Other statistical analysis about objects on the heap

dotnet-gcdump

In .NET Core 3.1, weโ€™re introducing a new tool that allows you to capture the aforementioned process dumps for analysis in PerfView and Visual Studio.

You can install this .NET global tool by running the following command:

dotnet tool install --global dotnet-gcdump

Once youโ€™ve installed dotnet gcdump, you can capture a GC dump by running the following command:

dotnet gcdump collect -p <target-process-PID>

Note: Collecting a gcdump triggers a full Gen 2 garbage collection in the target process and can change the performance characteristics of your application. The duration of the GC pause experienced by the applicaiton is proportional to the size of the GC heap; applications with larger heaps will experience longer pauses.

The resulting .gcdump file can be analyzed in Visual Studio and PerfView on Windows.

Analyzing GC dumps in Visual Studio

The collected GC dumps can be analyzed by opening the .gcdump files in Visual Studio. Upon opening in Visual Studio, you are greeted with the Memory Analysis Report page.

Memory analysis report in Visual Studio 2019

The top pane shows the count and size of the types in the snapshot, including the size of all objects that are referenced by the type (Inclusive Size).

In the bottom pane, the Paths to Root tree displays the objects that reference the type selected in the upper pane. The Referenced Types tree displays the references that are held by the type selected in the upper pane.

In addition to the memory analysis report of just a single GC dump, Visual Studio also allows you to compare two gc dumps. To view details of the difference between the current snapshot and the previous snapshot, navigate to the Compare To section of the report and select another GC dump to serve as the baseline.
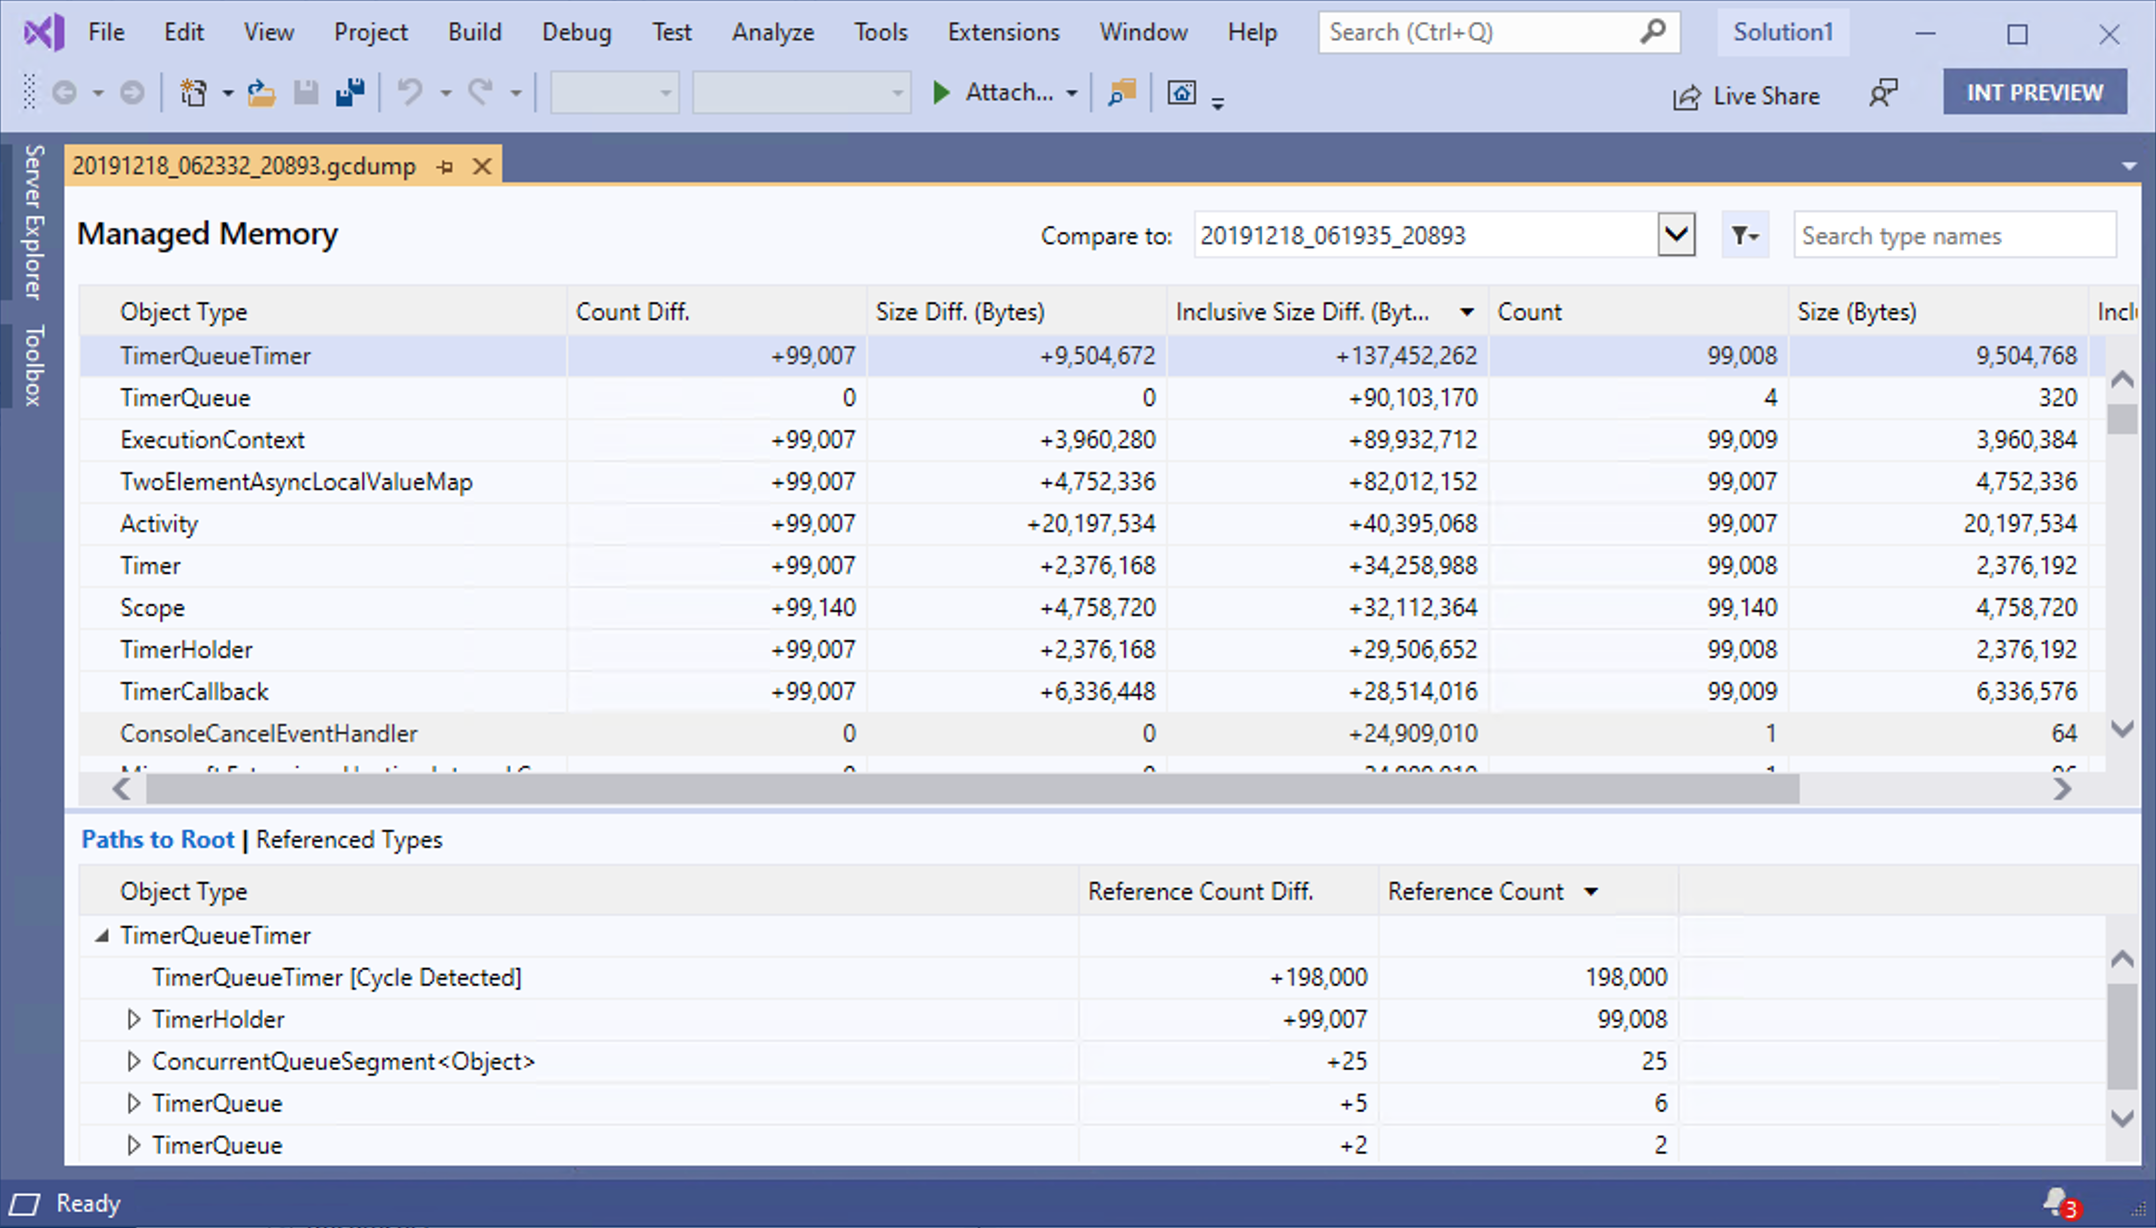
Memory analysis comparison in Visual Studio 2019

Closing

Thanks for trying out the new diagnostics tools in .NET Core 3.1. Please continue to give us feedback, either in the comments or on GitHub. We are listening carefully and will continue to make changes based on your feedback.

The post Collecting and analyzing memory dumps appeared first on .NET Blog.

...


๐Ÿ“Œ Collecting and analyzing memory dumps


๐Ÿ“ˆ 54.03 Punkte

๐Ÿ“Œ I Cash Out DUMPS+PINS and Regular DUMPS


๐Ÿ“ˆ 37.5 Punkte

๐Ÿ“Œ Buy Dumps With Pin ? โ€“ track 1 and 2 dumps with pin with high balance.


๐Ÿ“ˆ 37.5 Punkte

๐Ÿ“Œ Buy Dumps With Pin ? โ€“ track 1 and 2 dumps with pin with high balance..t


๐Ÿ“ˆ 37.5 Punkte

๐Ÿ“Œ Analyzing Password Dumps With My Tools โ€“ Part 1


๐Ÿ“ˆ 32.82 Punkte

๐Ÿ“Œ Find solutions faster by analyzing crash dumps in Visual Studio


๐Ÿ“ˆ 32.82 Punkte

๐Ÿ“Œ Dissect: Open-source framework for collecting, analyzing forensic data


๐Ÿ“ˆ 31.08 Punkte

๐Ÿ“Œ How Emily Gladstone Cole, Unix security specialist & co-author of a book on Solaris Security, went from analyzing tree DNA to analyzing code


๐Ÿ“ˆ 29.92 Punkte

๐Ÿ“Œ Extracting Event Logs or Other Memory Mapped Files from Memory Dumps


๐Ÿ“ˆ 24.46 Punkte

๐Ÿ“Œ Pe-Sieve - Recognizes And Dumps A Variety Of Potentially Malicious Implants (Replaced/Injected PEs, Shellcodes, Hooks, In-Memory Patches)


๐Ÿ“ˆ 22.95 Punkte

๐Ÿ“Œ Pe-Sieve - Recognizes And Dumps A Variety Of Potentially Malicious Implants (Replaced/Injected PEs, Shellcodes, Hooks, In-Memory Patches)


๐Ÿ“ˆ 22.95 Punkte

๐Ÿ“Œ Report: CIA behind APT34 and FSB hacks and data dumps


๐Ÿ“ˆ 21.43 Punkte

๐Ÿ“Œ Report: CIA most likely behind APT34 and FSB hacks and data dumps


๐Ÿ“ˆ 21.43 Punkte

๐Ÿ“Œ iPhone: iOS 11 bekommt Schutz gegen unerwรผnschte Memory-Dumps


๐Ÿ“ˆ 21.16 Punkte

๐Ÿ“Œ iPhone: iOS 11 bekommt Schutz gegen unerwรผnschte Memory-Dumps


๐Ÿ“ˆ 21.16 Punkte

๐Ÿ“Œ Dealing With False Positives when Scanning Memory Dumps for Cobalt Strike Beacons, (Sun, Aug 28th)


๐Ÿ“ˆ 21.16 Punkte

๐Ÿ“Œ Microsoft tests live kernel memory dumps in Windows 11 Task Manager


๐Ÿ“ˆ 21.16 Punkte

๐Ÿ“Œ Windows 11: Microsoft testet Live Kernel Memory Dumps


๐Ÿ“ˆ 21.16 Punkte

๐Ÿ“Œ Windows 11: Microsoft testet Live Kernel Memory Dumps - ZDNet.de


๐Ÿ“ˆ 21.16 Punkte

๐Ÿ“Œ Don't need Windows 10 memory dumps files? You can delete them โ€“ here's how.


๐Ÿ“ˆ 21.16 Punkte

๐Ÿ“Œ MemProcFS Analyzer v0.4 releases: Automated Forensic Analysis of Windows Memory Dumps


๐Ÿ“ˆ 21.16 Punkte

๐Ÿ“Œ Joy - A Package For Capturing And Analyzing Network Flow Data And Intraflow Data, For Network Research, Forensics, And Security Monitoring


๐Ÿ“ˆ 20.32 Punkte

๐Ÿ“Œ Analyzing and Reducing Ruby Memory Usage


๐Ÿ“ˆ 20.05 Punkte

๐Ÿ“Œ IRC Botnet Reverse Engineering Part 2 - Analyzing Memory Structures with x64dbg and IDA PRO (OALabs Tutorial)


๐Ÿ“ˆ 20.05 Punkte

๐Ÿ“Œ Facebook and Google Serve As Vectors For Misinformation While Hobbling Local Journalism and Collecting Taxpayer Subsidies, Group Says


๐Ÿ“ˆ 19.69 Punkte

๐Ÿ“Œ Bitglass Security Spotlight: 500px, Card Dumps, and UW Medicine


๐Ÿ“ˆ 19.64 Punkte

๐Ÿ“Œ Linux: processes core dumps, systemd-coredump and Debian


๐Ÿ“ˆ 19.64 Punkte

๐Ÿ“Œ Cloudflare dumps Google's reCAPTCHA, moves to hCaptcha as free ride ends (and something about privacy)


๐Ÿ“ˆ 19.64 Punkte

๐Ÿ“Œ NVIDIA finally dumps mandatory login for GeForce Experience and merges with the Control Panel app


๐Ÿ“ˆ 19.64 Punkte

๐Ÿ“Œ Dark Web drugs, data dumps and death: Which countries specialize in what services?


๐Ÿ“ˆ 19.64 Punkte

๐Ÿ“Œ Anonymous Dumps Database of Izmir Gaz to Protest Against Turkey and Erdogan


๐Ÿ“ˆ 19.64 Punkte

๐Ÿ“Œ Dark Web drugs, data dumps and death: Which countries specialize in what services?


๐Ÿ“ˆ 19.64 Punkte


matomo