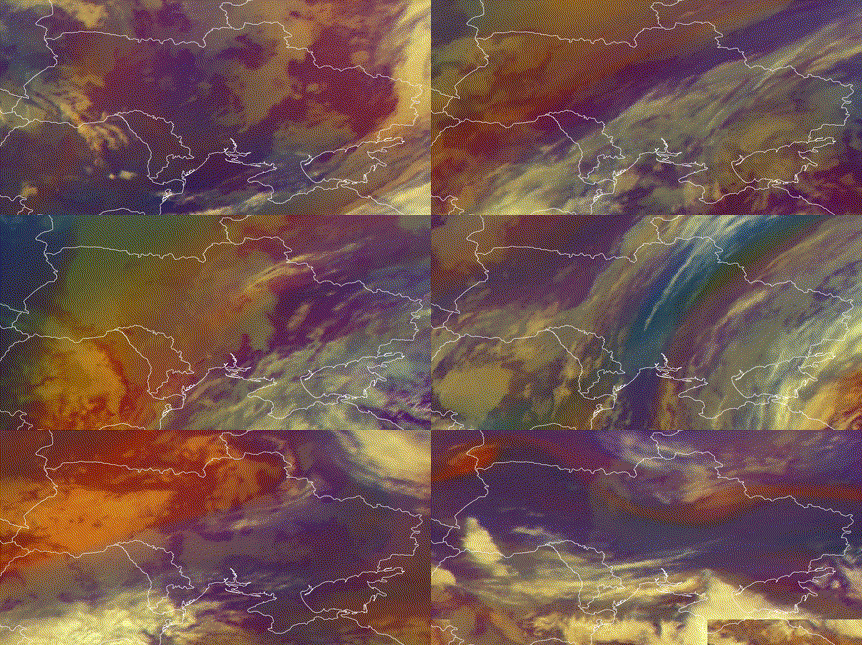
Figure 1: Airmass measurements (clouds) over Ukraine from February 18, 2022 - March 01, 2022 from the SEVIRI instrument. Data accessed via the imagery penetrates cloud cover, but requires special training to interpret. Automating this tedious task would enable real-time insights, but current computer vision methods developed on typical RGB imagery do not properly account for the phenomenology of SAR. This leads to suboptimal performance on this critical modality. Improving the access to and availability of SAR-specific methods, codebases, datasets, and pretrained models will benefit intelligence agencies, researchers, and journalists alike during this critical time for Ukraine.
In this post, we present a baseline method and pretrained models that enable the interchangeable use of RGB and SAR for downstream classification, semantic segmentation, and change detection pipelines.
Introduction
We live in a rapidly changing world, one that experiences natural disasters, civic upheaval, war, and all sorts of chaotic events which leave unpredictable—and often permanent—marks on the face of the planet. Understanding this change has historically been difficult. Surveyors were sent out to explore our new reality, and their distributed findings were often noisily integrated into a source of reality. Maintaining a constant state of vigilance has been a goal of mankind since we were able to conceive such a thought, all the way from when .
Vigilance, or to the French, surveillance, has been a part of human history for millenia. As with any tool, it has been a double-edged sword. Historically, surveillance without checks and balances has been detrimental to society. Conversely, the proper and responsible surveillance has allowed us to learn deep truths about our world which have resulted in advances in the domains. With the amount of satellites in orbit today, our understanding of the environment is updated almost daily. We have rapidly transitioned from having very little information to now having more data than we can meaningfully extract knowledge from. Storing this information, let alone understanding, is an engineering challenge that is of growing urgency.
Machine Learning and Remote Sensing
With , , the outputs of ML on EO imagery have been integrated into almost every facet of human society.
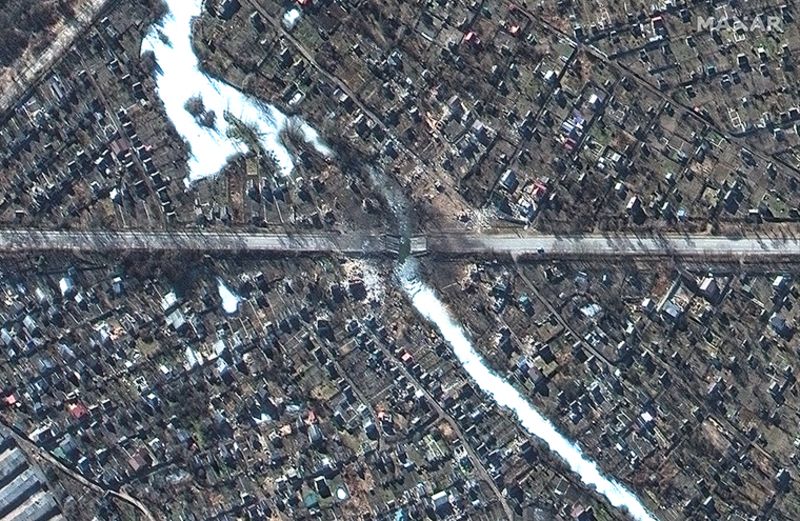
series of satellites operated by the United States Geological Survey and the , companies such as , .
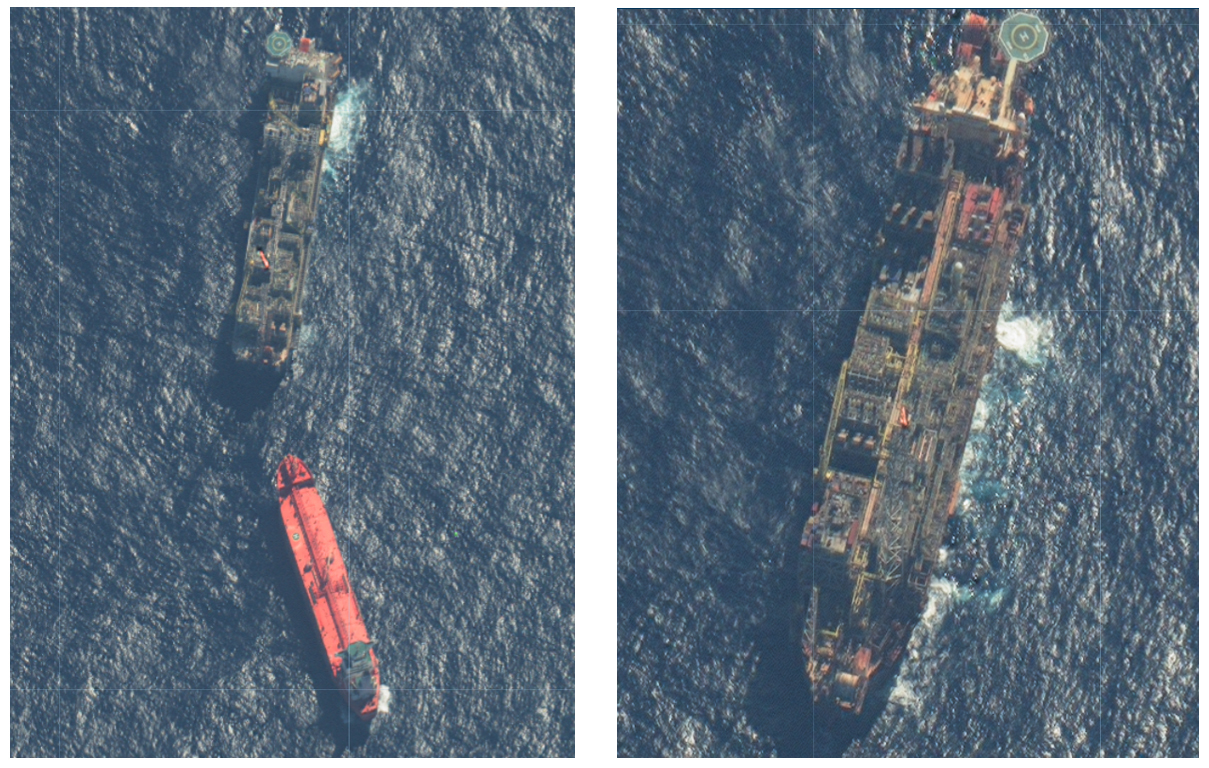
, and the has increased by orders of magnitude. Computer vision research has responded by , and even to satellite imagery. This has allowed commercial VHR imagery to be immediately useful with highly accurate results.
The Problem with Electro-Optical Imagery
For highly turbulent and risky situations such as war and natural disasters, having constant, reliable access to the Earth is paramount. Unfortunately, EO imagery cannot solve all of our surveillance needs. EO can only detect light sources during daytime, and as it turns out, . However, the loss of information is fundamentally irrecoverable.
Synthetic Aperture Radar Imagery
Synthetic aperture radar (SAR) imagery is an active form of remote sensing in which a satellite transmits pulses of microwave radar waves down to the surface of the Earth. These radar waves reflect off the ground and any objects on it and are returned back to the satellite. By processing these pulses over time and space, a SAR image is formed where each pixel is the superposition of different radar scatters.
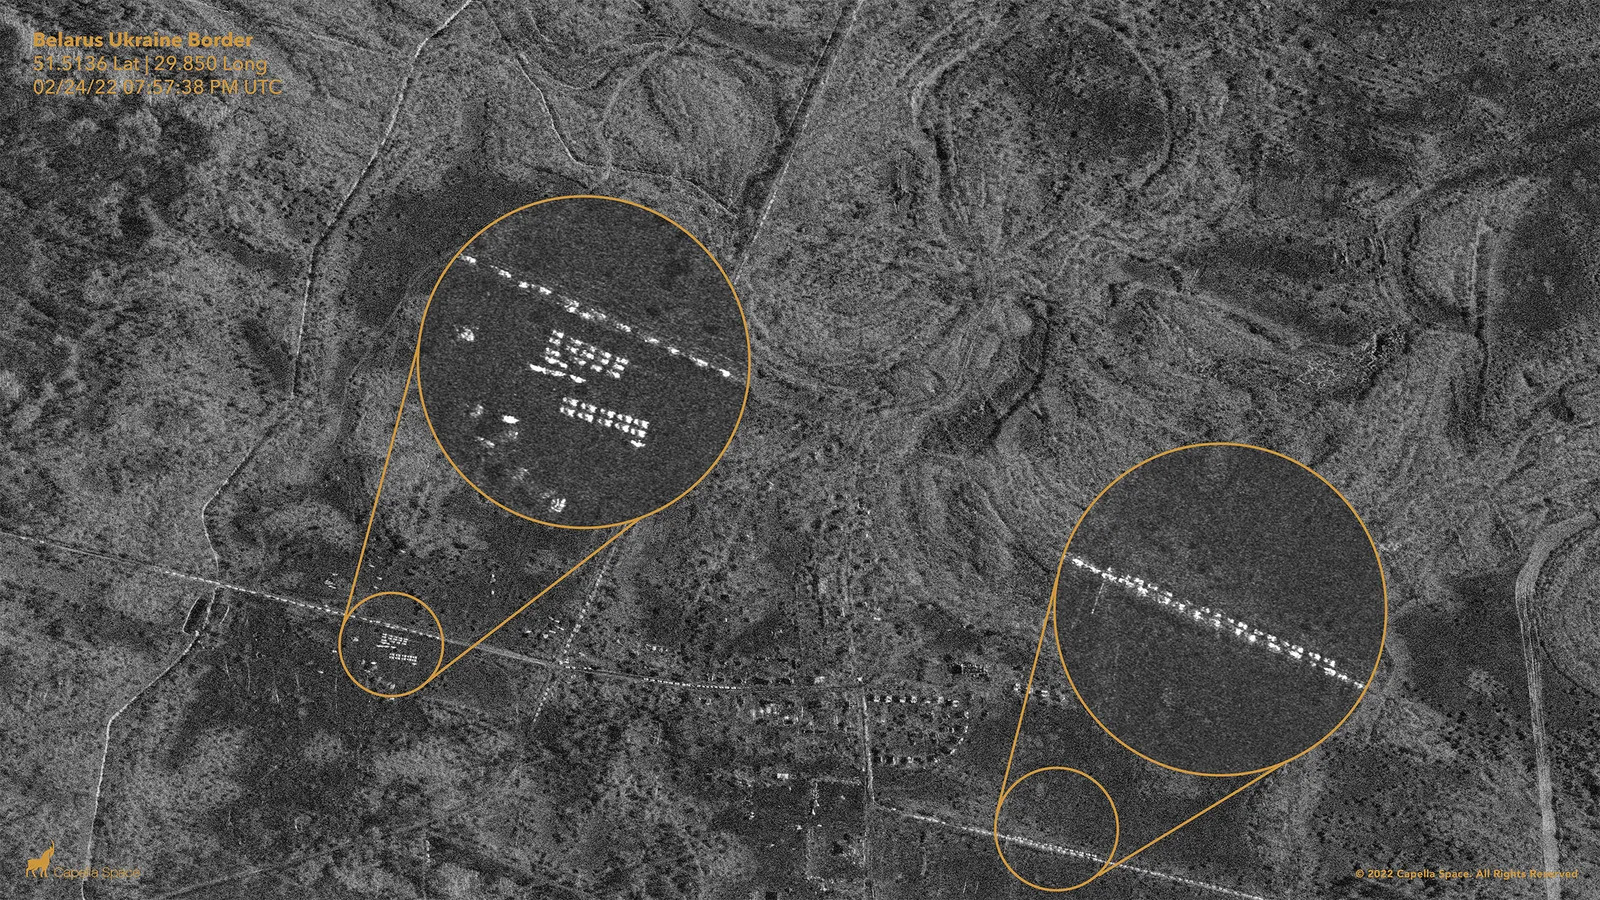
Radar waves penetrate clouds, and since the satellite is actively producing the radar waves, it illuminates the surface of the Earth even during the night. Synthetic aperture radar has a wide variety of uses, being used to , and to constellation provides imagery to the public at large with resolutions ranging from 10 - 80 meters (10 meter imagery being the most common. Most commercial SAR providers, such as , provide imagery down to 0.5 meter resolution. In upcoming launches, other commercial vendors aim to produce SAR imagery with sub-0.5 meter resolution with high revisit rates as satellite constellations grow and government regulations evolve.
The upper portion of the stadium is intersecting, seemingly, with the parking lot behind it.
Multi-path effects occur when radar waves reflect off of objects on the ground and incur multiple bounces before returning to the SAR sensor. Multi-path effects result in objects appearing in the imagery in various transformations in the resulting image. This effect can be seen everywhere in SAR imagery, but is particularly noticeable in urban areas, forests, and other dense environments.
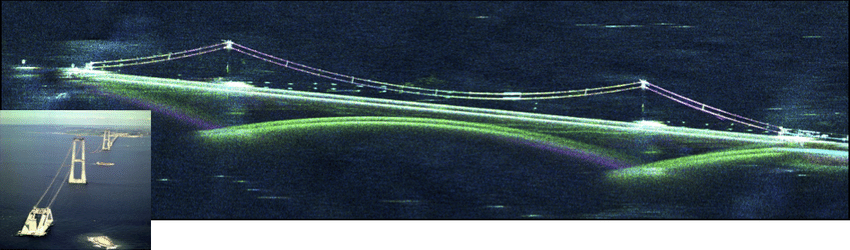
and the data from (MAE) recently introduced by He et. al., where the network learns to encode the input data by taking a masked version of the data as input, encoding the data, and then learning to decode the data in such a way that it reconstructs the unmasked input data.
Contrary to popular , and 2) semantic segmentation on the VHR EO and SAR architecture for semantic segmentation. Figure 11 shows the IoU performance of segmenting building footprints in a held-out validation component of the SpaceNet 6 with only SAR input imagery, on a segmentation model that was trained to use either SAR or RGB imagery. The MAERS pretrained model leads to a ~13 point improvement compared to training the RGB+SAR model from scratch or adapting ImageNet weights with the exact same architecture.
This demonstrates that MAERS can learn robust RGB+SAR representations that allow a practitioner to use EO or SAR imagery interchangeably to accomplish downstream tasks. It is important to note that the phenomenology of SAR imagery is not fully conducive for building segmentation and that using EO imagery for this task leads to IoU scores > 90. This leaves a substantial gap yet to be covered by SAR techniques, something we hope to cover in our following paper. However, getting this performance out of SAR is essential when environmental conditions are not conducive to EO imagery capture.
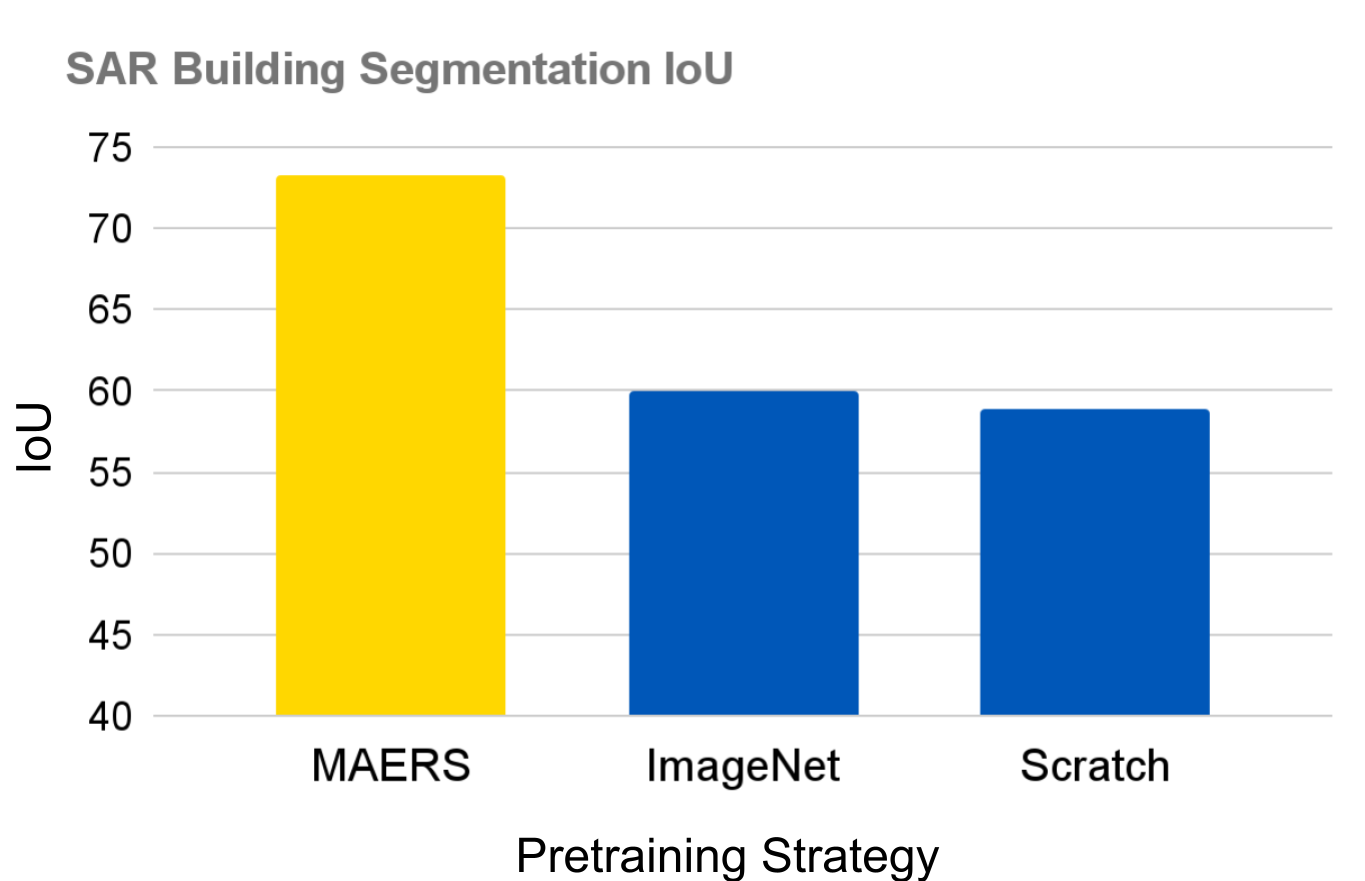
Figure 11: Building segmentation IoU on the SpaceNet 6 Challenge, using an UperNet segmentation model with a ViT backbone. MAERS pretraining leads to ~13 point gain in IoU performance compared to training from scratch or adapting ImageNet pretrained weights.
These results are preliminary, but compelling. We will follow up this effort with a publication with a detailed set of experiments and benchmarks. Furthermore, we will aid in the transition of our models to our humanitarian partners to enable them to perform change detection over residential and other civilian areas to enable better tracking of war crimes being committed in Ukraine.
These models are created with the goal of increasing the efficacy of organizations involved in humanitarian missions that are keeping a watchful eye on the war in Ukraine. However, as with any technology, it is our responsibility to understand how this technology could be misused. Therefore, we have designed these models with input from partners who perform intelligence and imagery analysis in humanitarian settings. By taking into account their thoughts, comments, and critiques, we are releasing a capability we are confident will be used for the good of humanity and with processes which dictate their safe and responsible use.
Call to Action
As citizens of free democracies who develop technologies which help us make sense of the complicated, chaotic, and counter-intuitive world that we live in, we have a responsibility to act when acts of injustice occur. Our colleagues and friends in Ukraine are facing extreme uncertainties and danger. We possess skills in the cyber domain that can aid in the fight against Russian forces. By focusing our time and efforts, whether that be through targeted research or volunteering our time in . Full distribution will follow once we have completed a thorough assessment of our models.
Acknowledgements
Thank you to at the Department of Defense’s . Perhaps, in the future, 0.3m resolution imagery will no longer be VHR. ↩

SOCIAL SHARE CARD GENERATOR