




Hello, buzdies! 👋
Pandas is one of the most helpful Python libraries used by millions of data scientists and analysts today. Along with other libraries like Matpotlib, Numpy, and Plotly, Pandas has been the backbone of numerous large-scale projects.
If we take a simple example, think that you have a CSV file. With pandas, we can make it a data frame— or we can say a "table" with some data. And then, with just a simple keyword, you can find and analyze the data of each column and row— The mean, average, max, min, and everything!
In this tutorial also, we’re going to learn the fundamentals of Pandas which will give you a perfect start for your data analysis journey. And one more advantage, you’re going to analyze your Amazon data as well!
Oh, by the way, code samples in this tutorial can be found in the GitHub repository as well.
https://github.com/Buzzpy/Amazon-Data-Analysis
Getting Started
Install Pandas(
pip install pandas) and import it (import pandas as pd)Download Amazon Data Report
Sign in to your Amazon Account.
Go to Your Account > Account.
In the Order and Shopping Preferences section, select “Download order reports”.
In case you’re not an active Amazon user, here’s a small CSV file containing some of my personal data (some data aren't present)
But wait, what is Pandas?
Pandas is a beloved library used by both Data scientists and analysts. So if you’re a data geek, Pandas is an essential skill you’ll need.

The reason Pandas is among the top data science libraries is that it has many built-in functions that help to analyze and clean data in seconds. Below are the widely used Pandas functions.
pd.read_csv(): To read CSV files.pd. DataFrame(): Convert Python objects (such as Lists) to a DataFrame. No need to use it when using CSV files.df.head(): df stands for DataFrame andhead()can be used to show the first 5 rows whiletail()is used to show last 5 rows.df.shape(): To find no: of rows and columns.df. isna(): Find null values.df.fillna(): Fill empty cells with something, say 0.df.astype(): Convert data types.df.sum(): Get the sum of values in a column.df.columns(): Get the full list of columns.df.drop_dulicates(): Drop all the duplicates.
Reading Data 🔎
Now you can guess the code we can use to read our CSV file with Pandas. Yup, we will use the pd.read_csv() function. But before that, make sure you’ve imported Pandas library as below.
import pandas as pd


df = pd.read_csv('Amazon Dataset.csv')

pd.set_option('display.max_columns', None) # display all the columns

print(df)
The output would print all the data in your CSV file.
Data Cleaning 🧹
In any project related to Data, cleaning data is an important step.
In the previous output, you’ve seen that some columns have values called “NaN”— which means no data is present. Therefore, let’s deal with Null values first. Don’t worry, it has become very simple with Pandas built-in function df.fillna()
If you compare the output of this code with the previous one. You will notice that those ‘NaN’ values have been replaced with 0.0.
The next thing we need to do is delete duplicates. Even though this CSV file might not contain any duplicates, it’s always a good practice.
df.drop_duplicates()

pd.set_option('display.max_columns', 36) # display all the columns

df = df.fillna(0)

print(df)
There’s one more important job. In the output, you saw that some columns(Item Total) contain Price in USD, with a dollar sign ($) in front of them. This makes its data type a String, which is a barrier to calculations with it.
So we have to use the following code to remove the dollar sign and convert it to an Integer.
df.drop_duplicates()

pd.set_option('display.max_columns', 36) # display all the columns

df = df.fillna(0)

df["Item Total"] = df["Item Total"].str.replace('$','').astype(float)

print(df)
Output:
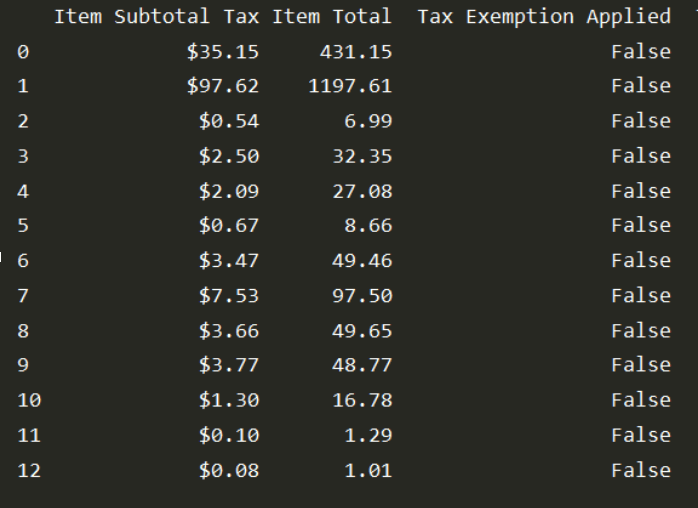
That’s Awesome! We can move to the next part now.
Find the total spending
The most interesting part is here! Now let’s see how much you’ve spent on Amazon. Since we have converted the Item Total column to floats, it’s easy to take the sum of the column using sum() function.
df = df.fillna(0)

df["Item Total"] = df["Item Total"].str.replace('$','').astype(float)


print(df["Item Total"].sum())
For this dataset, my result was:
1968.2999999999997
That means I’ve spent almost $2000 on Amazon. Gosh, that’s a lot for me. How much was yours?
Highest, Minimum, Average
Now let’s find out what’s my highest spending. The only thing you have to do is update the previous code using max() function instead of sum().
print(df["Item Total"].max())
And my result was:
999.57
Well, I must find what I have which is worth a thousand dollars!
To calm down after finding your biggest purchase, let’s find what is our lowest purchase price. In this time too, you have just to replace max() with min().
print(df["Item Total"].min())
And the output was:
1.01
Which means my least spending on Amazon is $1.01.
The final task of this tutorial is to find your average spending on Amazon. We will be using mean() function, replacing min() in the previous code.
print(df["Item Total"].mean())
Output:
151.4076923076923
Ignoring decimals, my average spending was $151 but to make sure, I'm going to use the median() function as well.
print(df["Item Total"].median()
Output:
96.02
That's quite different, right?
The difference between the mean and median in our dataset indicates that the distribution of "Item Total" values is skewed, probably due to a few high-spending outliers. The mean is sensitive to extreme values, and their influence pulls it higher than the median, which is less affected by outliers. This means that a small number of significant purchases are impacting the overall average, causing the mean to be higher than the median.
If we want a more clear representation of our average spending habits, the best idea is to create a visual representation such as a histogram. But as for these tutorials, we'll continue like this— our average spend is between $96 - $151.

Conclusion
In this tutorial, we learned much about Pandas— functions, different terms, etc. The key takeaway is that Pandas is a powerful and easy-to-use data analysis library that helps developers make their lives a lot easier when working with data.
https://github.com/Buzzpy/Amazon-Data-Analysis
Happy Coding!
————————————————————————————
Enjoyed the article? Make sure to subscribe to "The Buzzletter" so you will never miss any of my content + any gifts I offer! 🐳
