

 800+ IT
News
als RSS Feed abonnieren
800+ IT
News
als RSS Feed abonnieren📚 What Next? Exploring Graph Neural Network Recommendation Engines
💡 Newskategorie: AI Nachrichten
🔗 Quelle: towardsdatascience.com
It’s so difficult to decide what to watch next. Let’s build an AI algorithm to do it for us!

The recommendation of content is a common application of machine learning and artificial intelligence. This article will review a Graph Neural Network approach to content recommendation, using Link Regression. The objective is to build a content recommendation engine that predicts how a user would rate unseen content based on their ratings of content they have seen.
We will start with a concept review of Graph Neural Networks (GNNs) along with an introduction to PyTorch Geometric (PyG), a GNN package in Python. Then we will apply these concepts to a recommendation engine of our own to get AI-powered content recommendations.
Thank you for taking the time to read and as always the code on my GitHub and useful links will be available in the references at the end of the post.
Concept Review
Let’s start with a concept review; it’s really important to understand all of the moving parts of Graph Neural Networks or GNNs before we can use one. Before we start to understand GNNs it’s most important to understand graphs! So let’s review what we mean when we talk about graphs in this context.
Graph Data Structures
When I talk about a graph in the context of a GNN, I am referring to a Graph Data Structure. This is not the same thing as a chart or a figure which is used to visualise data, as you would sometimes expect from the word ‘graph’.
It might be useful to think of graph data structures in the context of a social network. This is similar to how social media sites store data. Imagine your Facebook profile. You might be connected to your brother and your old friend from high school, and the graph data structure would look like this:
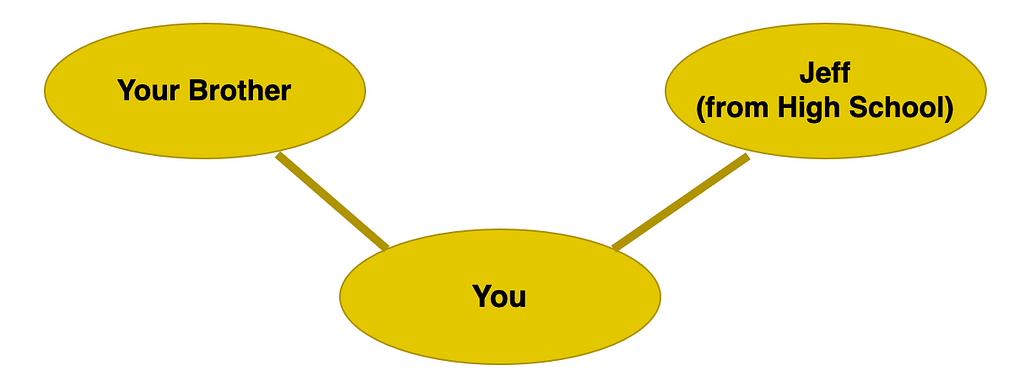
Each person is a node, which just means a dot in our representation. Our nodes have characteristics like the names of the people they represent. Each connection is an edge and they represent a link (friendship) between two nodes.
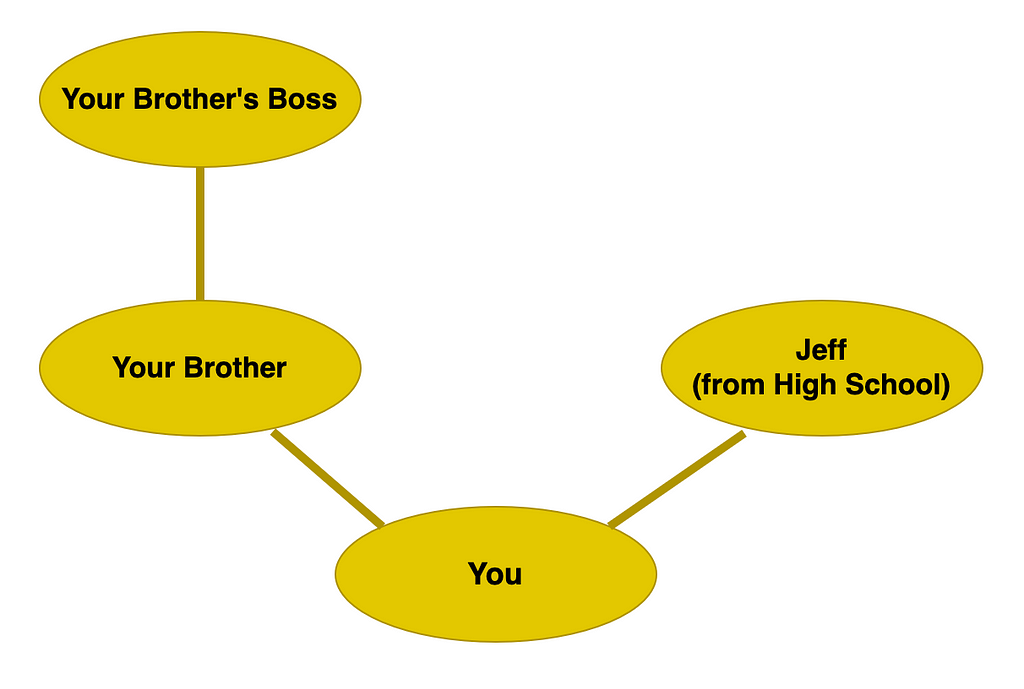
Now, it is no stretch for us to expand this network. Your brother may be connected to his boss. Now we have an important concept and idea. This is the idea of degrees of separation. We can (somewhat safely) assume that your opinions and preferences are more closely aligned with your brother than with your brother’s boss. This is simply because you are directly connected to your brother but you have to make a jump to get to his boss:
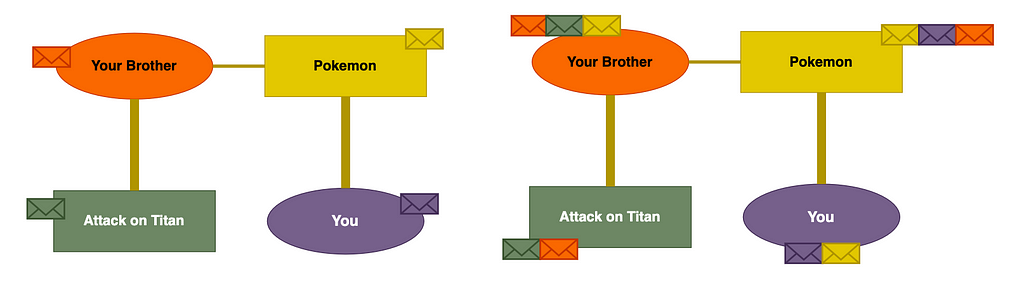
Now, let’s revisit that old friend from high school. We already know our nodes can have characteristics like names and ages. Let’s now build on that by giving our edges characteristics too! Let’s say the number of times you message a friend gives the edge a characteristic. We will call this the edge weight. In our example this may look something like this, where the edge weight is expressed in the thickness of the edge; more messages equates to a thicker line:
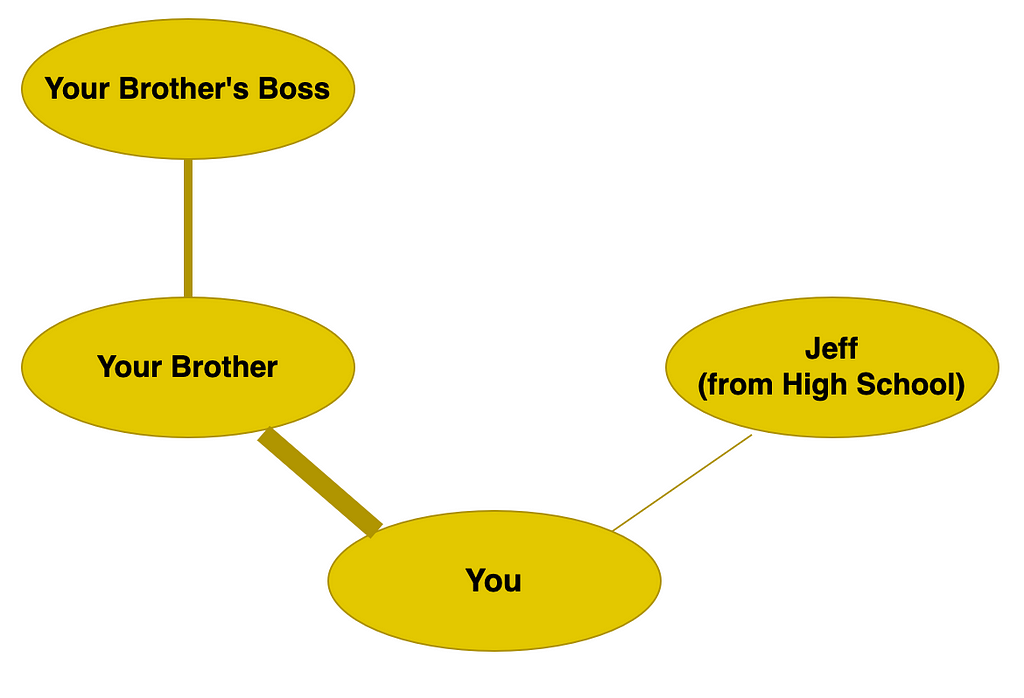
Now that we know the weight of an edge, we can use that too in building up our idea of preference and opinion. Someone you message regularly is, again, more likely to enjoy the same things you do; that’s why you are friends! So from this example, we can not only say your brother is more like you than someone further down the line of connections, but also that you have more in common than someone else who is directly connected to you.
The final complication we can add here is making our graph heterogenous. This is just a fancy way of saying there are two types of node. Let’s apply this example to our project and say we have people and anime:
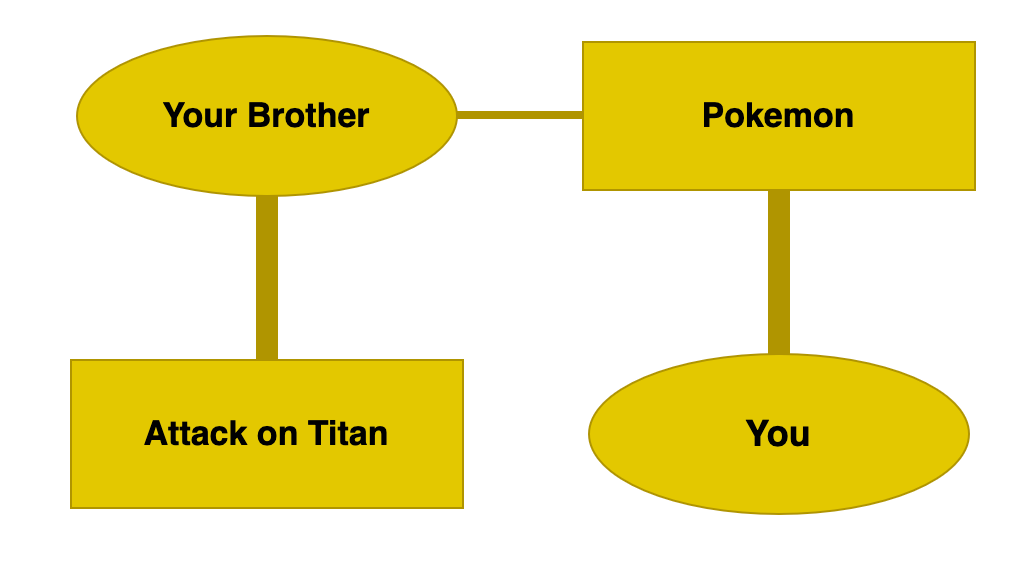
This final graph is very close to the actual data used in this project. We can see that you and your brother both enjoyed Pokemon. Your brother also really enjoyed Attack on Titan. So in this simple graph, we can already see how an algorithm could recommend Attack on Titan to you!
As we multiply this idea out we can start to see how massive graphs of data can be used to make judgments and suggestions for millions of users, so it’s no wonder why Netflix knows you want to watch The Office for the thousandth time. But it’s okay… we all do! Let’s now examine how these graph datasets are used by a neural network.
Graph Neural Networks
Graph Neural Networks, or GNNs, are an extension of Neural Networks, in that they use Graph Data Structures or Geometric data instead of the typical tabular data structures used by more traditional Neural Networks. This means they are at a foundational level very similar, both have input, hidden, and output layers. Both have several different types of layers in common too including Convolutional and Linear layers that are explored here. The main difference is in how the data is treated before and during the training process.
In this project, Graph SAGE is used which is a layer in the neural network. Graph SAGE among other possible options is responsible for message passing. This is also sometimes called encoding. The message-passing process just involves building an understanding of each node and edge based on its neighbors:
Each node passes a message to its neighboring nodes. This gives the network an understanding of the type of users who watch this anime, as well as an understanding of the type of anime this user likes! There is a note that is particularly relevant to this point in the application section.
The SAGE layer is a type of Convolutional layer. We can compare this to a Convolutional layer in a CNN for image recognition. Instead of building an understanding of the image based on neighboring pixels, here we do it based on neighboring nodes! To get a better understanding of this process, an amazing YouTube series is recommended at the end of this article.
The final bit of our network is simply using a Linear layer to predict the rating! The linear layer works in much the same way as in other neural networks. Producing a regression that predicts the rating based on the features it has been given. We can use multiple Linear layers at the end of our network to give a set number of output neurons that represent our prediction. This concludes the concept review!
Application of GNN using PyTorch Geometric
The practical application of this project follows along with the PyTorch Geometric example for link regression and applies it to the anime dataset. A link to the PyTorch Geometric code is given at the end of the article.

Now let’s stop sitting around and get building!
The data used for the project comes from Kaggle and is based on user ratings of various anime. The dataset has been sampled with 6,000 unique users and their ratings of different anime taken. The data is sampled due to limited training resources which may affect the accuracy of the model. Future work could see increased resources used to train this model.
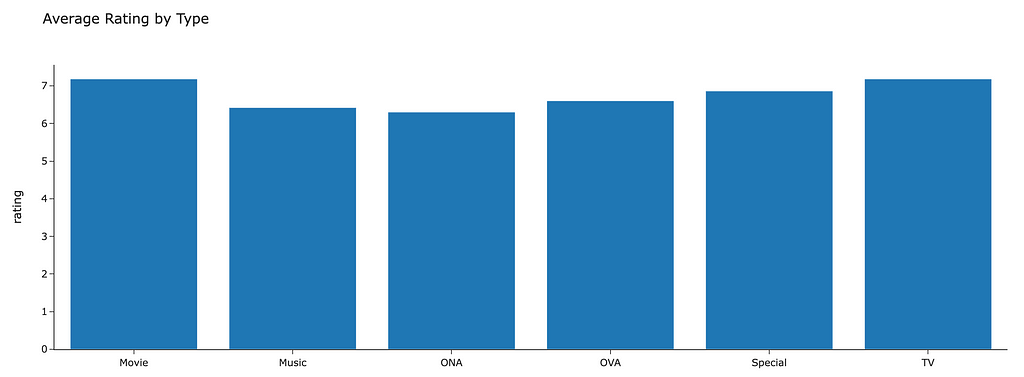
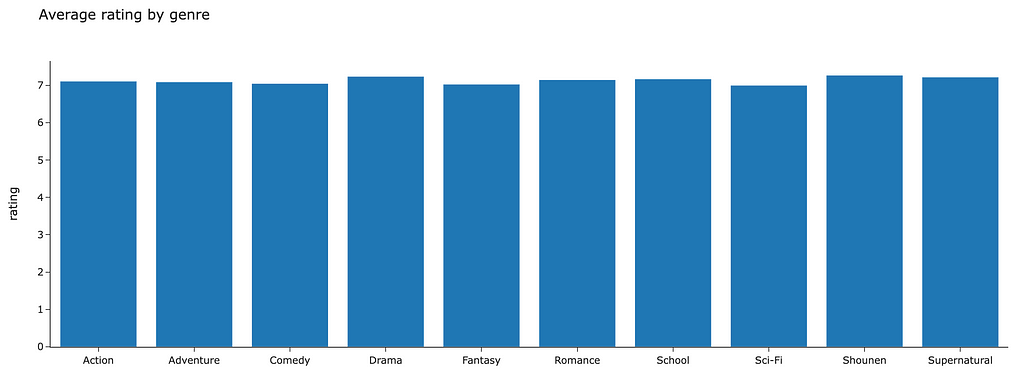
Some visualizations are given below to get a quick understanding of the dataset as well as some features of the anime that may affect user ratings:
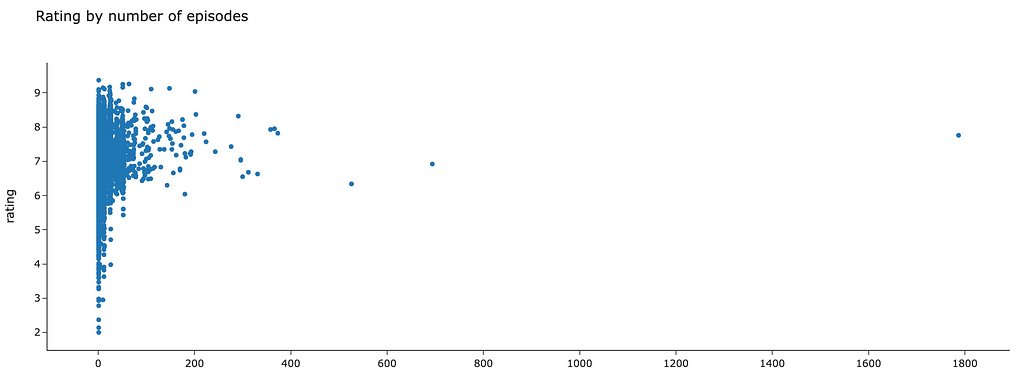
The scatter plot gives a sense of scale as to just how many individual pieces of content we are dealing with!
Feature Engineering
The features above that seem to affect average ratings the most are the type of anime (Movie, Series, etc…) and the genre (Action, Comedy, etc…). These will be used as node features in the network. The code for this step is given below. The features are taken into tensors and then concatenated along the same axis so that each node has features related to its type and genre:
https://medium.com/media/4f2a25872845759107b64f45785a418d/hrefThese node features will be useful, however, we can also extract an additional feature the title of the anime. To do this, a sentence transformer is used to generate an embedding of the title. This embedding is also used as a feature:
https://medium.com/media/d69c98502227efaa6afdf3d0909afed2/hrefThis embedding based on the anime title might be a useful feature, as the network could pick up on users rating content similarly based on the name. For example, users who like “Pokemon: X and Y” might also like “Pokemon: Diamond and Pearl”. The embeddings for each would also be similar.
Building a Graph Dataset
The feature selected above will allow the network to learn about how users interact with different types, genres, and titles of anime. The network can use these features to make better predictions. It is also possible to use user-features but for simplicity, we will just give the anime features. It is important to note that both users and anime will be nodes in our graph dataset. The code to build this object is quite complicated; the first step involves building a sequential set of IDs for users and anime and mapping those back onto the original data. The next step shown in the code below involves using those mappings to build the PyTorch data object:
https://medium.com/media/9d11f5b22e23366ec029708190c2cc97/hrefNote: In building our graph dataset, we make it Undirected. So each user is rating an anime with a rating label, but each anime is also rating a user with the same label. This is so that the message-passing step allows each node to learn about itself and all of its connections. This may not be appropriate in all applications but here it enables the graph to understand more about the type of users who watch this anime and the type of anime this user enjoys.
Building a Graph Neural Network
For those familiar with PyTorch, the Geometric equivalent will look very similar. This application uses three different objects:
- GNN Encoder — Use SageConv layers to encode graph features with message passing.
- The Edge decoder — Use Linear layers to decode the edges and predict the ratings.
- Model class — combines the above two objects and defines the overall training process of encoding/decoding.
Each of the encoder and decoder objects implements just two functions:
- An init function — Defines the structure of the layers.
- A forward function — Defines the transformations taken on the input to the layers.
A graphical representation of our network would look something like this:
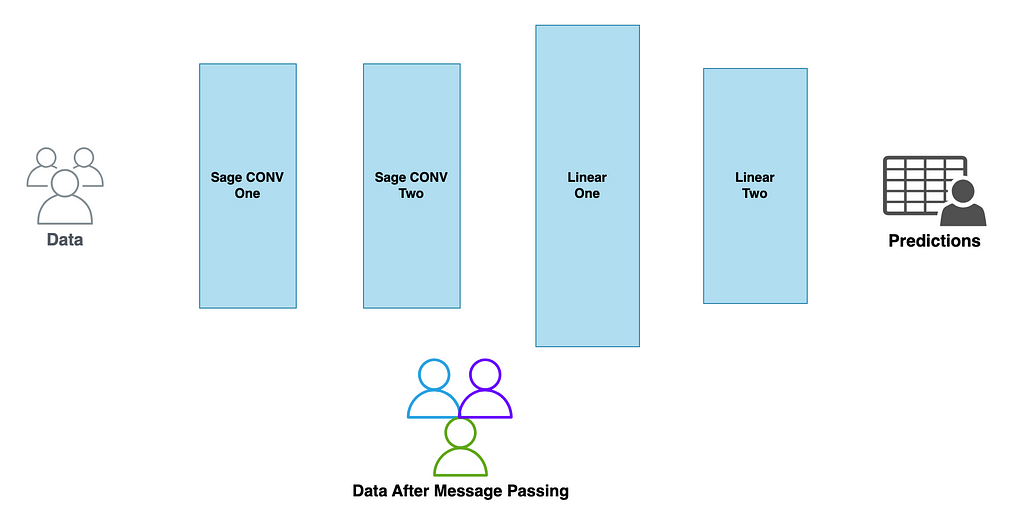
This is a good chance to review why the GNN is so good for Graph data structures:
- The input layer (Sage CONV) has no fixed input size so a graph of any size can be used to build that embedding
- Once the embedding of the graph is built through the message passing layers (Graph SAGE One and Two) more traditional layers like Linear layers can be used
In code, this is:
https://medium.com/media/ead19389d9775480781abb557bda7d74/hrefThe final step is building out the training process. In this example, I have chosen to use the RMSE measure for loss. This code is fairly standard for training neural networks in PyTorch so please check the documentation or leave a comment if you would be interested in a more detailed article on this:
https://medium.com/media/afdf592ea69527e44f36180021e0aa7c/hrefOnce the training process is defined we begin to train the model.
Evaluating the model
Before the model is evaluated it is important to highlight one drawback of the dataset. That is the ratings provided are actually ordinal given at absolute values i.e. 0, 1, 2, … so strictly speaking a regression isn’t the most appropriate decision. In a real-world scenario, this may be a problem but for this project, we will stick with the regression approach and round our values at the end.
Before evaluating it is important we use our unseen test data to make final judgments on the model. It is also important in this case that we clamp our predictions so that the model only predicts between 0 and 10 the available values for users rating anime:
https://medium.com/media/8049528d29c126460b824692128d35a9/hrefWhen evaluating the model we used the Root Mean Square Error (RMSE) in predictions. On assessing the model we can see that the overall RMSE (on unseen test data) was 1.23.
We can review what this looks like across each different actual rating using the charts below:
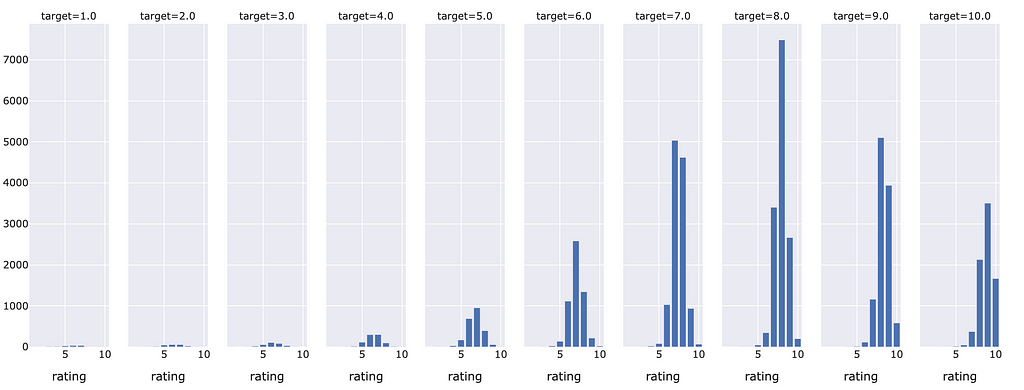
Not very many anime had below a five rating so given that training samples were more scarce, the model had a hard time predicting an accurate low score. That being said, the higher ratings were commonly predicted correctly. Particularly around an 8 target rating where the model seemed to estimate the most correct ratings.
In a deployed product, the model would make estimates and then return either these raw scores to users, or in some cases we could see a threshold set. For example, if the model predicts you will rate content at a 7 or above, then the algorithm will recommend that you watch the anime.
There are also future recommendations for a project like this. For example, exploring the use of link prediction instead of link regression or even link classification. There is also a suggestion that more of the training data, hyperparameter tuning or other boosted learning methods could be used, however, that was outside of the resource limits for me! Until then I’ve got lots of great new content recommendations to get on with thanks to my Graph Neural Network!
This concludes the exploration of graph neural networks as recommendation engines. Throughout this project, I’ve learned a lot about graph data structures as well as GNNs. There is also a lot more to learn so please stick around for a future article where I will explore explainable AI using this codebase and the Captum Python Package.
References
Code:
Dataset (licensed in the Public Domain, CC0 https://creativecommons.org/publicdomain/zero/1.0/):
Anime Recommendations Database
YouTube Explainer series on GNNs: https://www.youtube.com/watch?v=fOctJB4kVlM
PyTorch Geometric Docs:
PyG Documentation - pytorch_geometric documentation
PyTorch Geometric Link Regression Example:
Sage Conv Medium Article from Sahil Sheikh:
Exploring SageConv: A Powerful Graph Neural Network Architecture
What Next? Exploring Graph Neural Network Recommendation Engines was originally published in Towards Data Science on Medium, where people are continuing the conversation by highlighting and responding to this story.
...