

 800+ IT
News
als RSS Feed abonnieren
800+ IT
News
als RSS Feed abonnieren📚 Matplotlib Tutorial: Life Expectancy & Genocide
💡 Newskategorie: Programmierung
🔗 Quelle: dev.to
Background
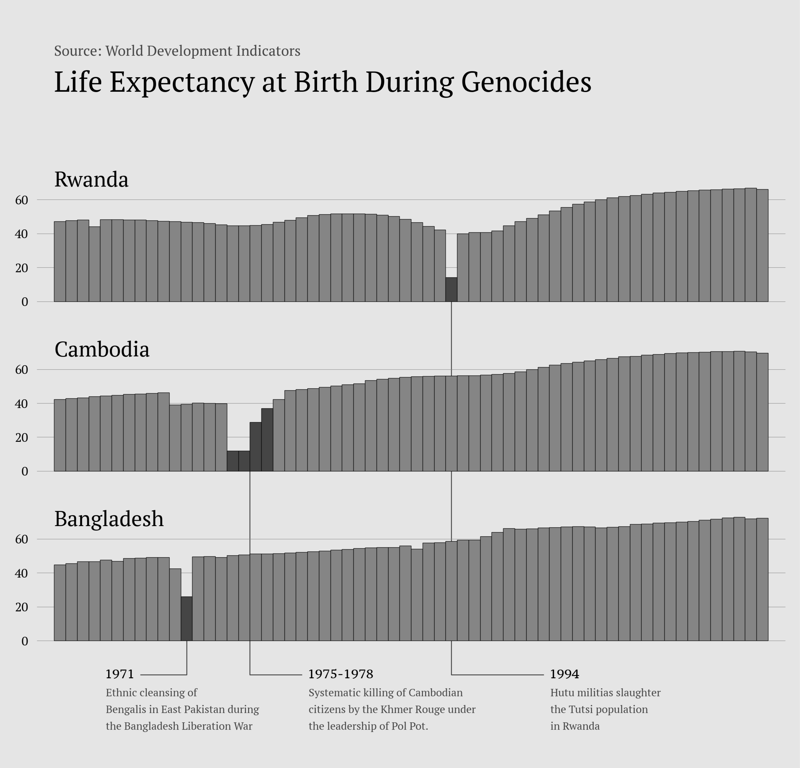
In this tutorial, I'm creating a horrifying data visualization about how life expectancy at birth changed in Bangladesh, Rwanda, and Cambodia during their genocides. I'm using data from the World Bank open data platform, which you should check out.
If you like this tutorial and visualization, make sure to sign up for my free newsletter, The Data Sensei.
Step 1: Imports
We don't need anything special for this tutorial
import pandas as pd
import seaborn as sns
import matplotlib.pyplot as plt

from matplotlib.patches import Rectangle
from matplotlib.lines import Line2D
Step 2: Styling
I always use Seaborn to create a style that suits the data. You can't use cheerful colors when you design a plot with data like what we have in this tutorial. Since I still want a bright chart, I only use grayscale colors.
font_family = "DejaVu Serif"
background_color = "#e5e5e5"
light_gray = "#858585"
dark_gray = "#454545"
text_color = "#000000"

sns.set_style({
    "axes.facecolor": background_color + "00",
    "figure.facecolor": background_color,
    "axes.edgecolor": text_color,
    "axes.grid": True,
    "axes.axisbelow": True,
    "grid.color": light_gray,
    "text.color": text_color,
    "font.family": font_family,

    "xtick.color": text_color,
    "ytick.color": text_color,
    "xtick.bottom": False,
    "xtick.top": False,
    "ytick.left": False,
    "ytick.right": False,

    "axes.spines.left": False,
    "axes.spines.bottom": False,
    "axes.spines.right": False,
    "axes.spines.top": False,
})
Step 3: Helper functions
When I create plots, I always create reusable functions, but in this tutorial, I only have one. It's a really simple data visualization, so I don't need more.
def color(v, threshold=38):
    return light_gray if v > threshold else dark_gray
Step 4: Shared styles
Defining shared styles you reuse in several places outside the main functions is a good idea. It's always annoying when you have to change things like color and font sizes in multiple locations, and it's easy to introduce a design bug that you don't find in time.
BAR_STYLE = {"width": 1, "edgecolor": text_color}
LINE_STYLE = {"zorder": -10, "color": dark_gray, "linewidth": 2}
YEAR_STYLE = {"va": "center", "fontsize": 28, "fontfamily": "PT Serif Caption"}
INFO_STYLE = {"ha": "left", "va": "top", "fontsize": 24, "linespacing": 1.8, "color": dark_gray}
Step 5: Loading data
I have created a preprocessed dataset so that you can focus on the Matplotlib code. The CSV has four columns, one for each country and the year of the values. The values represent life expectancy at birth, which means how long someone born that year can expect to live. As you will see, that value changes drastically over time.
data = pd.read_csv(
    "https://raw.githubusercontent.com/oscarleoo/matplotlib-tutorial-data/main/life_expectancy_genocide.csv"
)
Step 6: Data visualization
Now, it's time to create the actual chart. It's a straightforward chart where I use Rectangle to draw the bars, and everything else basically adds information using lines and text. I'm using Rectangle instead of something like seaborn.barplot() because it gives me more control, and I don't need subplots. With subplots, I find it more difficult to add custom styles.
There are some hard-coded values to decide the text position, but I've found that it's faster than trying to automate the placement. All charts require some custom design to get the right feel.
fig = plt.figure(figsize=(30, 30))
ax = fig.add_subplot()
ax.set(ylim=(-68, 3.7*100), xlim=(-2, 63))

# Add bars
for i, row in data.iterrows():
    ax.add_artist(Rectangle((i-0.5, 200), height=row.rwanda, facecolor=color(row.rwanda), **BAR_STYLE))
    ax.add_artist(Rectangle((i-0.5, 100), height=row.cambodia, facecolor=color(row.cambodia), **BAR_STYLE))
    ax.add_artist(Rectangle((i-0.5, 0), height=row.bangladesh, facecolor=color(row.bangladesh), **BAR_STYLE))

# Add country names
ax.annotate("Rwanda", (-0.5, 265), ha="left", va="bottom", fontsize=48)
ax.annotate("Cambodia", (-0.5, 165), ha="left", va="bottom", fontsize=48)
ax.annotate("Bangladesh", (-0.5, 65), ha="left", va="bottom", fontsize=48)

# Tick formatting
ax.tick_params(labelsize=28, pad=16)
ax.set_xticks([])
ax.set_yticks(
    ticks = [0, 20, 40, 60, 100, 120, 140, 160, 200, 220, 240, 260],
    labels = ["0", "20", "40", "60", "0", "20", "40", "60", "0", "20", "40", "60"]
)

# Add lines
ax.add_artist(Line2D([11, 11, 7], [0, -20, -20], **LINE_STYLE))
ax.add_artist(Line2D([16.5, 16.5, 21], [100, -20, -20], **LINE_STYLE))
ax.add_artist(Line2D([34, 34, 42], [200, -20, -20], **LINE_STYLE))

# Bangladesh info
ax.annotate("1971", (6.5, -20), ha="right", **YEAR_STYLE)
ax.annotate(
    "Ethnic cleansing of\n"
    "Bengalis in East Pakistan during\n"
    "the Bangladesh Liberation War.", (3.8, -28), **INFO_STYLE
)

# Cambodia info
ax.annotate("1975-1978", (21.5, -20), ha="left", **YEAR_STYLE)
ax.annotate(
    "Systematic killing of Cambodian\n"
    "citizens by the Khmer Rouge under\n"
    "the leadership of Pol Pot.", (21.6, -28), **INFO_STYLE
)

# Rwanda info
ax.annotate("1994", (42.5, -20), ha="left", **YEAR_STYLE)
ax.annotate(
    "Hutu militias slaughter\n"
    "the Tutsi population\n"
    "in Rwanda", (42.6, -28), **INFO_STYLE
)

# Title and source
title = "Life Expectancy at Birth During Genocides"
ax.annotate(title, (-0.5, 320), ha="left", va="bottom", fontsize=64)
ax.annotate("Source: World Development Indicators", (-0.5, 343), ha="left", va="bottom", fontsize=32, color=dark_gray)

plt.show()
When you run this code, you get the following visualization.
Conclusion
Above, you see the final data visualization. It might not look beautiful at first glance, but remember that we have a sad message that we must keep in mind when creating the design. I'm happy that the chart doesn't contain little information but is easy to understand immediately. I think the color scheme is good, and the entire data visualization gives a sober newspaper feel.
...