



ML Engineering 101: A Thorough Explanation of The Error “DataLoader worker (pid(s) xxx) exited unexpectedly”
A deep dive into PyTorch DataLoader with Multiprocessing
As one of the many who use the PyTorch library on a day-to-day basis, I believe many ML engineer sooner or later encounters the problem “DataLoader worker (pid(s) xxx) exited unexpectedly” during training.
It’s frustrating.
This error is often triggered when calling the DataLoader with parameter num_workers > 0. Many online posts provide simple solutions like setting the num_workers=0, which makes the current issue go away but causes problems new in reality.
This post will show you some tricks that may help resolve the problem. I’m going to do a deeper dive into the Torch.multiprocessing module and show you some useful virtual memory monitoring and leakage-preventing techniques. In a really rare case, the asynchronous memory occupation and release of the torch.multiprocessing workers could still trigger the issue, even without leakage. The ultimate solution is to optimize the virtual memory usage and understand the torch.multiprocessing behaviour, and perform garbage collection in the __getitem_ method.
Note: the platform I worked on is Ubuntu 20.04. To adapt to other platforms, many terminal commands need to be changed.

Brute-force Solution and the Cons
If you search on the web, most people encountering the same issue will tell you the brute-force solution; just set num_workers=0 in the DataLoader, and the issue will be gone.
It will be the easiest solution if you have a small dataset and can tolerate the training time. However, the underlying issue is still there, and if you have a very large dataset, setting num_workers=0 will result in a very slow performance, sometimes 10x slower. That’s why we must look into the issue further and seek alternative solutions.
Monitor Your Virtual Memory Usage
What exactly happens when the dataloader worker exits?
To catch the last error log in the system, run the following command in the terminal, which will give you a more detailed error message.
dmesg -T
Usually, you’ll see the real cause is “out of memory”. But why is there an out-of-memory issue? What specifically caused the extra memory consumption?
When we set num_workers =0 in the DataLoader, a single main process runs the training script. It will run properly as long as the data batch can fit into memory.
However, when setting num_workers > 0, things become different. DataLoader will start child processes alongside preloading prefetch_factor*num_workers into the memory to speed things up. By default, prefetch_factor = 2. The prefetched data will consume the machine’s virtual memory (but the good news is that it doesn’t eat up GPUs, so you don’t need to shrink the batch size). So, the first thing we need to do is to monitor the system’s virtual memory usage.
One of the easiest ways to monitor virtual memory usage is the psutil package, which will monitor the percentage of virtual memory being used
import psutil
print(psutil.virtual_memory().percent)
You can also use the tracemalloc package, which will give you more detailed information:
snapshot = tracemalloc.take_snapshot()
top_stats = snapshot.statistics('lineno')
for stat in top_stats[:10]:
    print(stat)
When the actual RAM is full, idle data will flow into the swap space (so it’s part of your virtual memory). To check the swap, use the command:
free -m
And to change your swap size temporarily during training (e.g., increase to 16G) in the terminal:
swapoff -a
fallocate -l 16G /swapfile
chmod 600 /swapfile
mkswap /swapfile
swapon /swapfile
/dev/shm (or, in certain cases, /run/shm ) is another file system for storing temporary files, which should be monitored. Simply run the following, and you will see the list of drives in your file system:
df -h
To resize it temporarily (e.g., increase to 16GB), simply run:
sudo mount -o remount,size=16G /dev/shm
Torch.multiprocessing Best Practices
However, virtual memory is only one side of the story. What if the issue doesn’t go away after adjusting the swap disk?
The other side of the story is the underlying issues of the torch.multiprocessing module. There are a number of best practices recommendations on the official webpage:
Multiprocessing best practices - PyTorch 2.3 documentation
But besides these, three more approaches should be considered, especially regarding memory usage.
The first thing is shared memory leakage. Leakage means that memory is not released properly after each run of the child worker, and you will observe this phenomenon when you monitor the virtual memory usage at runtime. Memory consumption will keep increasing and reach the point of being “out of memory.” This is a very typical memory leakage.
So what will cause the leakage?
Let’s take a look at the DataLoader class itself:
https://github.com/pytorch/pytorch/blob/main/torch/utils/data/dataloader.py
Looking under the hood of DataLoader, we’ll see that when nums_worker > 0, _MultiProcessingDataLoaderIter is called. Inside _MultiProcessingDataLoaderIter, Torch.multiprocessing creates the worker queue. Torch.multiprocessing uses two different strategies for memory sharing and caching: file_descriptor and file_system. While file_system requires no file descriptor caching, it is prone to shared memory leaks.
To check what sharing strategy your machine is using, simply add in the script:
torch.multiprocessing.get_sharing_strategy()
To get your system file descriptor limit (Linux), run the following command in the terminal:
ulimit -n
To switch your sharing strategy to file_descriptor:
torch.multiprocessing.set_sharing_strategy(‘file_descriptor’)
To count the number of opened file descriptors, run the following command:
ls /proc/self/fd | wc -l
As long as the system allows, the file_descriptor strategy is recommended.
The second is the multiprocessing worker starting method. Simply put, it’s the debate as to whether to use a fork or spawn as the worker-starting method. Fork is the default way to start multiprocessing in Linux and can avoid certain file copying, so it is much faster, but it might have issues handling CUDA tensors and third-party libraries like OpenCV in your DataLoader.
To use the spawn method, you can simply pass the argument multiprocessing_context= “spawn”. to the DataLoader.
Three, make the Dataset Objects Pickable/Serializable
There is a super nice post further discussing the “copy-on-read” effect for process folding: https://ppwwyyxx.com/blog/2022/Demystify-RAM-Usage-in-Multiprocess-DataLoader/
Simply put, it’s no longer a good approach to create a list of filenames and load them in the __getitem__ method. Create a numpy array or panda dataframe to store the list of filenames for serialization purposes. And if you’re familiar with HuggingFace, using a CSV/dataframe is the recommended way to load a local dataset: https://huggingface.co/docs/datasets/v2.19.0/en/package_reference/loading_methods#datasets.load_dataset.example-2
What If You Have a Really Slow Loader?
Okay, now we have a better understanding of the multiprocessing module. But is it the end of the story?
It sounds really crazy. If you have a large and heavy dataset (e.g., each data point > 5 MB), there is a weird chance of encountering the above issues, and I’ll tell you why. The secret is the asynchronous memory release of the multiprocessing workers.
The trick is simple: hack into the torch library and add a psutil.virtual_memory().percent line before and after the data queue in the _MultiProcessingDataLoaderIter class:
pytorch/torch/utils/data/dataloader.py at 70d8bc2da1da34915ce504614495c8cf19c85df2 · pytorch/pytorch
Something like
print(“before clearing”, psutil.virtual_memory().percent)
data = self._data_queue.get(timeout=timeout)
print("after", psutil.virtual_memory().percent)
In my case, I started my DataLoader with num_workers=8 and observed something like the following:
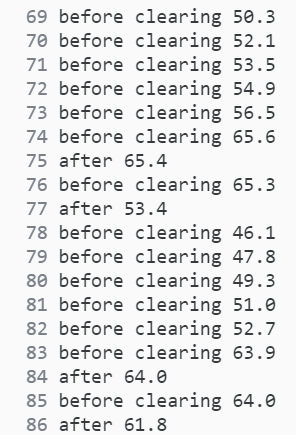
So the memory keeps flowing up — but is it memory leakage? Not really. It’s simply because the dataloader workers load faster than they release, creating 8 jobs while releasing 2. And that’s the root cause of the memory overflowing. The solution is simple: just add a garbage collector to the beginning of your __getitem__ method:
import gc
def __getitem__(self, idx):
    gc.collect()
And now you’re good!

References
- https://pytorch.org/docs/stable/multiprocessing.html#sharing-strategies
- https://stackoverflow.com/questions/76491885/how-many-file-descriptors-are-open
- https://psutil.readthedocs.io/en/latest/index.html#psutil.virtual_memory
- https://stackoverflow.com/questions/4970421/whats-the-difference-between-virtual-memory-and-swap-space
- https://ploi.io/documentation/server/change-swap-size-in-ubuntu
- https://stackoverflow.com/questions/58804022/how-to-resize-dev-shm
- https://pytorch.org/docs/stable/data.html
- https://britishgeologicalsurvey.github.io/science/python-forking-vs-spawn/
- https://stackoverflow.com/questions/64095876/multiprocessing-fork-vs-spawn
ML Engineering 101: A Thorough Explanation of The Error “DataLoader worker (pid(s) xxx) exited… was originally published in Towards Data Science on Medium, where people are continuing the conversation by highlighting and responding to this story.
SOCIAL SHARE CARD GENERATOR