



Discover why Welch’s t-Test is the go-to method for accurate statistical comparison, even when variances differ.

Part 1: Background
In the first semester of my postgrad, I had the opportunity to take the course STAT7055: Introductory Statistics for Business and Finance. Throughout the course, I definitely felt a bit exhausted at times, but the amount of knowledge I gained about the application of various statistical methods in different situations was truly priceless. During the 8th week of lectures, something really interesting caught my attention, specifically the concept of Hypothesis Testing when comparing two populations. I found it fascinating to learn about how the approach differs based on whether the samples are independent or paired, as well as what to do when we know or don’t know the population variance of the two populations, along with how to conduct hypothesis testing for two proportions. However, there is one aspect that wasn’t covered in the material, and it keeps me wondering how to tackle this particular scenario, which is performing Hypothesis Testing from two population means when the variances are unequal, known as the Welch t-Test.
To grasp the concept of how the Welch t-Test is applied, we can explore a dataset for the example case. Each stage of this process involves utilizing the dataset from real-world data.
Part 2: The Dataset
The dataset I’m using contains real-world data on World Agricultural Supply and Demand Estimates (WASDE) that are regularly updated. The WASDE dataset is put together by the World Agricultural Outlook Board (WAOB). It is a monthly report that provides annual predictions for various global regions and the United States when it comes to wheat, rice, coarse grains, oilseeds, and cotton. Furthermore, the dataset also covers forecasts for sugar, meat, poultry, eggs, and milk in the United States. It is sourced from the Nasdaq website, and you are welcome to access it for free here: WASDE dataset. There are 3 datasets, but I only use the first one, which is the Supply and Demand Data. Column definitions can be seen here:
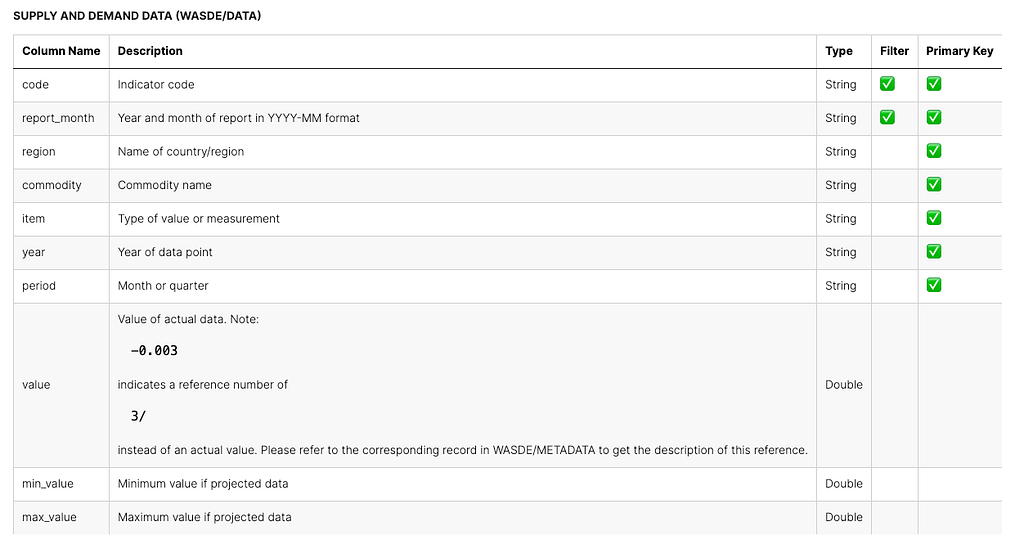
I am going to use two different samples from specific regions, commodities, and items to simplify the testing process. Additionally, we will be using the R Programming Language for the end-to-end procedure.
Now let’s do a proper data preparation:
library(dplyr)

# Read and preprocess the dataframe
wasde_data <- read.csv("wasde_data.csv") %>%
  select(-min_value, -max_value, -year, -period) %>%
  filter(item == "Production", commodity == "Wheat")

# Filter data for Argentina and Australia
wasde_argentina <- wasde_data %>%
  filter(region == "Argentina") %>%
  arrange(desc(report_month))

wasde_oz <- wasde_data %>%
  filter(region == "Australia") %>%
  arrange(desc(report_month))
I divided two samples into two different regions, namely Argentina and Australia. And the focus is production in wheat commodities.
Now we’re set. But wait..
Before delving further into the application of the Welch t-Test, I can’t help but wonder why it is necessary to test whether the two population variances are equal or not.
Part 3: Testing Equality of Variances
When conducting hypothesis testing to compare two population means without knowledge of the population variances, it’s crucial to confirm the equality of variances in order to select the appropriate statistical test. If the variances turn out to be the same, we opt for the pooled variance t-test; otherwise, we can use Welch’s t-test. This important step guarantees the precision of the outcomes, since using an incorrect test could result in wrong conclusions due to higher risks of Type I and Type II errors. By checking for equality in variances, we make sure that the hypothesis testing process relies on accurate assumptions, ultimately leading to more dependable and valid conclusions.
Then how do we test the two population variances?
We have to generate two hypotheses as below:
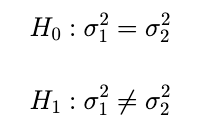
The rule of thumb is very simple:
- If the test statistic falls into rejection region, then Reject H0 or Null Hypothesis.
- Otherwise, we Fail to Reject H0 or Null Hypothesis.
We can set the hypotheses like this:
# Hypotheses: Variance Comparison
h0_variance <- "Population variance of Wheat production in Argentina equals that in Australia"
h1_variance <- "Population variance of Wheat production in Argentina differs from that in Australia"
Now we should do the test statistic. But how do we get this test statistic? we use F-Test.
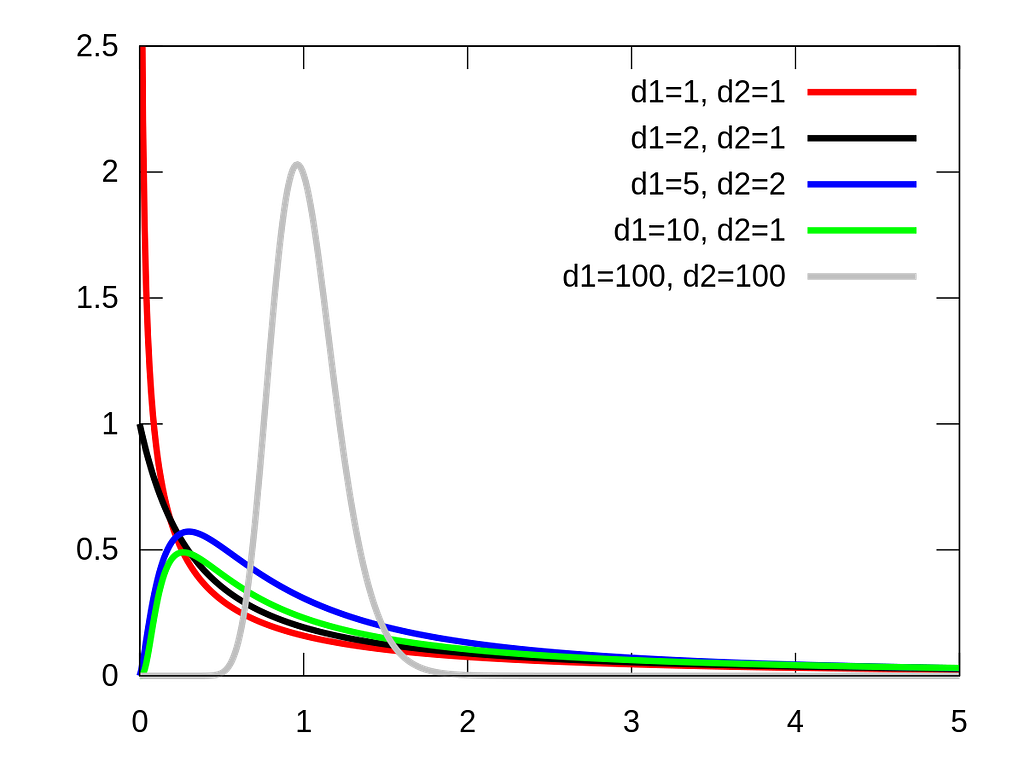
An F-test is any statistical test used to compare the variances of two samples or the ratio of variances between multiple samples. The test statistic, random variable F, is used to determine if the tested data has an F-distribution under the true null hypothesis, and true customary assumptions about the error term.
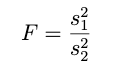
we can generate the test statistic value with dividing two sample variances like this:
and the rejection region is:

where n is the sample size and alpha is significance level. so when the F value falls into either of these rejection region, we reject null hypothesis.
but..
the trick is: The labeling of sample 1 and sample 2 is actually random, so let’s make sure to place the larger sample variance on top every time. This way, our F-statistic will consistently be greater than 1, and we just need to refer to the upper cut-off to reject H0 at significance level α whenever.
we can do this by:
# Calculate sample variances
sample_var_argentina <- var(wasde_argentina$value)
sample_var_oz <- var(wasde_oz$value)

# Calculate F calculated value
f_calculated <- sample_var_argentina / sample_var_oz
we’ll use 5% significance level (0.05), so the decision rule is:
# Define significance level and degrees of freedom
alpha <- 0.05
alpha_half <- alpha / 2
n1 <- nrow(wasde_argentina)
n2 <- nrow(wasde_oz)
df1 <- n1 - 1
df2 <- n2 - 1

# Calculate critical F values
f_value_lower <- qf(alpha_half, df1, df2)
f_value_upper <- qf(1 - alpha_half, df1, df2)

# Variance comparison result
if (f_calculated > f_value_lower & f_calculated < f_value_upper) {
  cat("Fail to Reject H0: ", h0_variance, "\n")
  equal_variances <- TRUE
} else {
  cat("Reject H0: ", h1_variance, "\n")
  equal_variances <- FALSE
}
the result is we reject Null Hypothesis at significance level of 5%, in other words, from this test we believe the population variances from the two populations are not equal. Now we know why we should use Welch t-Test instead of Pooled Variance t-Test.
Part 4: The main course, Welch t-Test
The Welch t-test, also called Welch’s unequal variances t-test, is a statistical method used for comparing the means of two separate samples. Instead of assuming equal variances like the standard pooled variance t-test, the Welch t-test is more robust as it does not make this assumption. This adjustment in degrees of freedom leads to a more precise evaluation of the difference between the two sample means. By not assuming equal variances, the Welch t-test offers a more dependable outcome when working with real-world data where this assumption may not be true. It is preferred for its adaptability and dependability, ensuring that conclusions drawn from statistical analyses remain valid even if the equal variances assumption is not met.
The test statistic formula is:
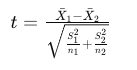
where:
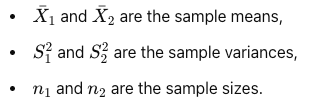
and the Degree of Freedom can be defined like this:
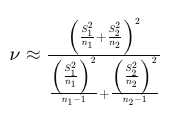
The rejection region for the Welch t-test depends on the chosen significance level and whether the test is one-tailed or two-tailed.
Two-tailed test: The null hypothesis is rejected if the absolute value of the test statistic |t| is greater than the critical value from the t-distribution with ν degrees of freedom at α/2.
- ∣t∣>tα/2,ν
One-tailed test: The null hypothesis is rejected if the test statistic t is greater than the critical value from the t-distribution with ν degrees of freedom at α for an upper-tailed test, or if t is less than the negative critical value for a lower-tailed test.
- Upper-tailed test: t > tα,ν
- Lower-tailed test: t < −tα,ν
So let’s do one example with One-tailed Welch t-Test.
lets generate the hypotheses:
h0_mean <- "Population mean of Wheat production in Argentina equals that in Australia"
h1_mean <- "Population mean of Wheat production in Argentina is greater than that in Australia"
this is a Upper Tailed Test, so the rejection region is: t > tα,ν
and by using the formula given above, and by using same significance level (0.05):
# Calculate sample means
sample_mean_argentina <- mean(wasde_argentina$value)
sample_mean_oz <- mean(wasde_oz$value)

# Welch's t-test (unequal variances)
s1 <- sample_var_argentina
s2 <- sample_var_oz
t_calculated <- (sample_mean_argentina - sample_mean_oz) / sqrt(s1/n1 + s2/n2)
df <- (s1/n1 + s2/n2)^2 / ((s1^2/(n1^2 * (n1-1))) + (s2^2/(n2^2 * (n2-1))))
t_value <- qt(1 - alpha, df)

# Mean comparison result
if (t_calculated > t_value) {
  cat("Reject H0: ", h1_mean, "\n")
} else {
  cat("Fail to Reject H0: ", h0_mean, "\n")
}
the result is we Fail to Reject H0 at significance level of 5%, then Population mean of Wheat production in Argentina equals that in Australia.
That’s how to conduct Welch t-Test. Now your turn. Happy experimenting!
Part 5: Conclusion
When comparing two population means during hypothesis testing, it is really important to start by checking if the variances are equal. This initial step is crucial as it helps in deciding which statistical test to use, guaranteeing precise and dependable outcomes. If it turns out that the variances are indeed equal, you can go ahead and apply the standard t-test with pooled variances. However, in cases where the variances are not equal, it is recommended to go with Welch’s t-test.
Welch’s t-test provides a strong solution for comparing means when the assumption of equal variances does not hold true. By adjusting the degrees of freedom to accommodate for the uneven variances, Welch’s t-test gives a more precise and dependable evaluation of the statistical importance of the difference between two sample means. This adaptability makes it a popular choice in various practical situations where sample sizes and variances can vary significantly.
In conclusion, checking for equality of variances and utilizing Welch’s t-test when needed ensures the accuracy of hypothesis testing. This approach reduces the chances of Type I and Type II errors, resulting in more reliable conclusions. By selecting the appropriate test based on the equality of variances, we can confidently analyze the findings and make well-informed decisions grounded on empirical evidence.
Resources
- Nasdaq Data Link. (n.d.). Nasdaq Data Link. Retrieved June 14, 2024, from https://data.nasdaq.com
- F-Test in Statistics. (2024, June 14). F-Test in Statistics. https://www.geeksforgeeks.org/f-test/
- Two Independent Samples Unequal Variance (Welch’s Test) — ENV710 Statistics Review Website. (n.d.). Two Independent Samples Unequal Variance (Welch’s Test) — ENV710 Statistics Review Website. Retrieved June 14, 2024, from https://sites.nicholas.duke.edu/statsreview/means/welch/
Welch’s t-Test: The Reliable Way to Compare 2 Population Means with Unequal Variances was originally published in Towards Data Science on Medium, where people are continuing the conversation by highlighting and responding to this story.
SOCIAL SHARE CARD GENERATOR