Three Zero-Cost Solutions That Take Hours, Not Months

But it doesn’t have to be this way.
Some of the most effective methods to cut down on data issues are also some of the most simple.
In this article, we’ll delve into three methods to quickly improve your company’s data quality, all while keeping complexity to a minimum and new costs at zero. Let’s get to it!
TL;DR
- Take advantage of old school database tricks, like ENUM data types, and column constraints.
- Create a custom dashboard for your specific data quality problem.
- Generate data lineage with one small Python script.
Take advantage of old school database tricks
In the last 10–15 years we’ve seen massive changes to the data industry, notably big data, parallel processing, cloud computing, data warehouses, and new tools (lots and lots of new tools).
Consequently, we’ve had to say goodbye to some things to make room for all this new stuff. Some positives (Microsoft Access comes to mind), but some are questionable at best, such as traditional data design principles and data quality and validation at ingestion. The latter will be the subject of this section.
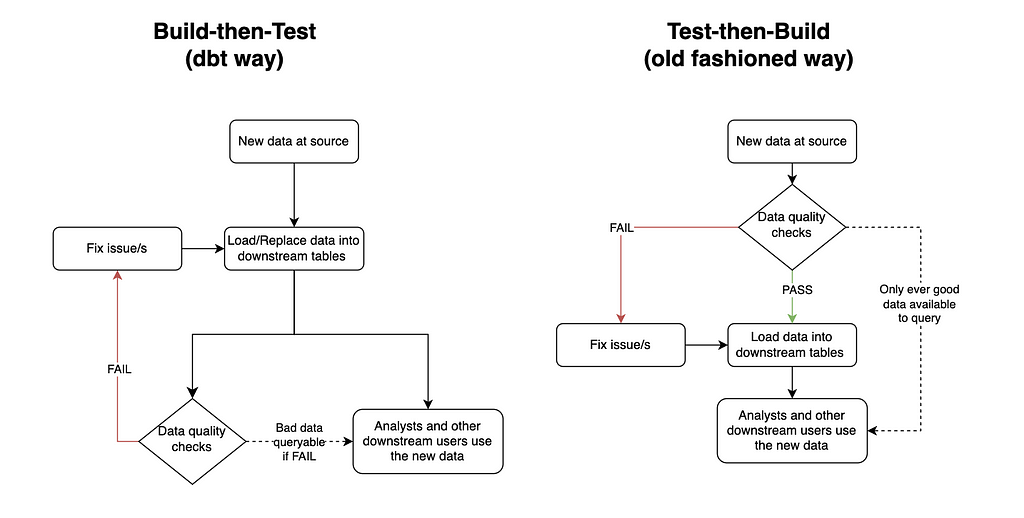
Firstly, what do I mean by “data quality and validation at ingestion”? Simply, it means checking data before it enters a table. Think of a bouncer outside a nightclub.
What it has been replaced with is build-then-test, which means putting new data in tables first, and then checking it later. Build-then-test is the chosen method for many modern data quality tools, including the most popular, ). However, engineers who only use this method of data quality are potentially missing out on some big wins for their organization.
This made the pipeline’s data quality a whole lot easier to manage. Not only was it much quicker for me to glance at where the issues were, but it was user-friendly enough for other people to read from too, allowing for shared responsibility.
After implementing the dashboard, bug tickets reported by the business related to the pipeline dropped to virtually zero, as did my risk of a stroke.
Map your data with a lineage chart
Simple data observability solutions don’t just stop at dashboards.
Data lineage can be a dream for quickly spotting what tables have been affected by bad data upstream.
However, it can also be a mammoth task to implement.
The number one culprit for this, in my opinion, is dbt. A key selling point of the open-source tool is its data lineage capabilities. But to achieve this you have to bow down to dbt’s framework. Including, but not limited to:
- Implementing ).
Yeah, it’s a lot.
But it doesn’t have to be. Ultimately, all you need for dynamic data lineage is a machine that scans your SQL files, and something to output a user-friendly lineage map. Thanks to Python, this can be achieved using a script with as few as 100 lines of code.
If you know a bit of Python and LLM prompting you should be able to hack the code in an hour. Alternatively, there’s a lightweight open-source Python tool called
That’s it. No server hosting costs. No extra computer languages to learn. No restructuring of your files. Just running one simple Python script locally.
Conclusion
Let’s face it — we all love shiny new in-vogue tools, but sometimes the best solutions are old, uncool, and/or unpopular.
The next time you’re faced with data quality headaches, take a step back before diving into that massive infrastructure overhaul. Ask yourself: Could a simple database constraint, a basic dashboard, or a lightweight Python script do the trick?
Your sanity will thank you for it. Your company’s budget will too.
on Medium, where people are continuing the conversation by highlighting and responding to this story.

SOCIAL SHARE CARD GENERATOR