
Introduction
After a considerable break from Python Flask development, I decided to refresh my skills by creating a practical project - a real-time laptop monitoring system. This project combines the simplicity of Flask with the power of Redis for real-time data handling, creating a responsive dashboard that displays crucial system metrics like CPU, memory, and disk usage.
Why Redis?
Redis, an in-memory data structure store, plays a crucial role in this project. It serves as a perfect solution for:
Real-time Data Storage: Storing rapidly changing system metrics efficiently
Fast Data Retrieval: Providing instant access to historical performance data
Time-Series Data: Managing temporal data for trend analysis and visualization
Lightweight: Minimal overhead compared to traditional databases
Built-in Data Structures: Utilizing Redis lists for storing time-series metrics
Prerequisites
Before diving into the project, ensure you have the following installed:
- Docker and Docker Compose
- Python 3.9 (included in the Docker image)
- Modern web browser for viewing the dashboard
- Basic understanding of Python, Flask, and Redis
Project Structure
laptop-monitor/

├── app/

│   ├── __init__.py

│   ├── monitor.py

│   ├── redis_client.py

│   ├── routes.py

│   └── templates/

│       └── index.html

├── static/

│   ├── css/

│   │   └── style.css

│   └── js/

│       └── script.js

├── Dockerfile

├── docker-compose.yml

└── requirements.txt
Code Implementation
1. Flask Application Initialization (app/init.py)
import sys

import os

sys.path.append(os.path.dirname(os.path.abspath(__file__)))


from flask import Flask

from routes import init_routes


app = Flask(__name__,

           static_folder='../static',

           static_url_path='')


init_routes(app)


if __name__ == "__main__":

    app.run(host="0.0.0.0", port=5000, debug=True)
2. System Monitoring (app/monitor.py)
import psutil


def get_metrics():

    return {

        'cpu_percent': psutil.cpu_percent(),

        'memory_percent': psutil.virtual_memory().percent,

        'disk_percent': psutil.disk_usage('/').percent

    }
3. Redis Client (app/redis_client.py)
import redis

import json

from datetime import datetime


redis_client = redis.Redis(host='redis', port=6379, db=0)


def store_metrics(metrics):

    timestamp = datetime.now().strftime('%Y-%m-%d %H:%M:%S')

    metrics['timestamp'] = timestamp

    redis_client.lpush('metrics', json.dumps(metrics))

    redis_client.ltrim('metrics', 0, 99)  # Keep last 100 entries


def get_metrics_history():

    metrics_history = redis_client.lrange('metrics', 0, -1)

    return [json.loads(m) for m in metrics_history]
4. Routes Configuration (app/routes.py)
from flask import render_template

from monitor import get_metrics

from redis_client import store_metrics, get_metrics_history


def init_routes(app):

    @app.route('/')

    def dashboard():

        metrics = get_metrics()

        store_metrics(metrics)

        history = get_metrics_history()

        return render_template('index.html', metrics=metrics, history=history)


    @app.route('/api/metrics')

    def api_metrics():

        return get_metrics()
5. Frontend Template (app/templates/index.html)
<!DOCTYPE html>

<html lang="en">

<head>

    <meta charset="UTF-8">

    <meta name="viewport" content="width=device-width, initial-scale=1.0">

    <title>Laptop Monitor</title>

    <script src="https://cdn.jsdelivr.net/npm/chart.js"></script>

    <link rel="stylesheet" type="text/css" href="/css/style.css">

</head>

<body>

    <div class="container">

        <h1>Laptop Performance Dashboard</h1>

        <div class="metrics-grid">

            <div class="metric-card">

                <h3>CPU Usage</h3>

                <p class="metric-value">{{ metrics.cpu_percent }}%</p>

            </div>

            <div class="metric-card">

                <h3>Memory Usage</h3>

                <p class="metric-value">{{ metrics.memory_percent }}%</p>

            </div>

            <div class="metric-card">

                <h3>Disk Usage</h3>

                <p class="metric-value">{{ metrics.disk_percent }}%</p>

            </div>

        </div>

        <div class="chart-container">

            <canvas id="performanceChart"></canvas>

        </div>

    </div>

    <script src="/js/script.js"></script>

</body>

</html>
6. Frontend Styling (static/css/style.css)
body {

    font-family: 'Segoe UI', Tahoma, Geneva, Verdana, sans-serif;

    background-color: #f4f7fa;

    margin: 0;

    padding: 0;

    color: #333;

}


.container {

    max-width: 1200px;

    margin: 40px auto;

    padding: 20px;

}


h1 {

    text-align: center;

    color: #2c3e50;

    margin-bottom: 30px;

    font-size: 2.5em;

}


.metrics-grid {

    display: grid;

    grid-template-columns: repeat(auto-fit, minmax(200px, 1fr));

    gap: 20px;

    margin-bottom: 40px;

}


.metric-card {

    background: #ffffff;

    border-radius: 10px;

    box-shadow: 0 4px 6px rgba(0, 0, 0, 0.1);

    padding: 20px;

    text-align: center;

    transition: transform 0.2s;

}


.metric-card:hover {

    transform: translateY(-5px);

}


.metric-card h3 {

    margin: 0 0 10px;

    color: #34495e;

    font-size: 1.2em;

}


.metric-value {

    font-size: 2em;

    font-weight: bold;

    color: #2980b9;

    margin: 0;

}


.chart-container {

    background: #ffffff;

    border-radius: 10px;

    box-shadow: 0 4px 6px rgba(0, 0, 0, 0.1);

    padding: 20px;

    max-width: 100%;

}


canvas {

    width: 100% !important;

    height: auto !important;

}
7. Frontend JavaScript (static/js/script.js)
let chart;

const maxDataPoints = 10;


function initChart() {

    const ctx = document.getElementById('performanceChart').getContext('2d');

    chart = new Chart(ctx, {

        type: 'line',

        data: {

            labels: [],

            datasets: [

                {

                    label: 'CPU Usage',

                    borderColor: '#2980b9',

                    data: [],

                    fill: false

                },

                {

                    label: 'Memory Usage',

                    borderColor: '#27ae60',

                    data: [],

                    fill: false

                },

                {

                    label: 'Disk Usage',

                    borderColor: '#c0392b',

                    data: [],

                    fill: false

                }

            ]

        },

        options: {

            responsive: true,

            scales: {

                y: {

                    beginAtZero: true,

                    max: 100

                }

            },

            animation: {

                duration: 0

            }

        }

    });

}


function updateMetrics() {

    fetch('/api/metrics')

        .then(response => response.json())

        .then(data => {

            // Update metric values

            document.querySelector('.metric-card:nth-child(1) .metric-value').textContent = `${data.cpu_percent}%`;

            document.querySelector('.metric-card:nth-child(2) .metric-value').textContent = `${data.memory_percent}%`;

            document.querySelector('.metric-card:nth-child(3) .metric-value').textContent = `${data.disk_percent}%`;


            // Update chart

            const timestamp = new Date().toLocaleTimeString();

            chart.data.labels.push(timestamp);

            chart.data.datasets[0].data.push(data.cpu_percent);

            chart.data.datasets[1].data.push(data.memory_percent);

            chart.data.datasets[2].data.push(data.disk_percent);


            // Remove old data points if exceeding maxDataPoints

            if (chart.data.labels.length > maxDataPoints) {

                chart.data.labels.shift();

                chart.data.datasets.forEach(dataset => dataset.data.shift());

            }


            chart.update();

        })

        .catch(error => console.error('Error fetching metrics:', error));

}


// Initialize chart when page loads

document.addEventListener('DOMContentLoaded', () => {

    initChart();

    // Update metrics every 2 seconds

    setInterval(updateMetrics, 2000);

});
8. Requirements (requirements.txt)
Flask==2.0.1

redis==4.0.2

psutil==5.8.0
9. Docker Configuration
Dockerfile
FROM python:3.9-slim

WORKDIR /app


# Copy requirements first to leverage Docker cache

COPY requirements.txt /app/

RUN pip install -r requirements.txt


# Create static directory structure explicitly

RUN mkdir -p /app/static/css /app/static/js


# Copy all application files

COPY . /app/


# Ensure proper permissions for static files

RUN chmod -R 755 /app/static


CMD ["python", "-m", "flask", "run", "--host=0.0.0.0"]
docker-compose.yml
services:

  flask-app:

    build: .

    ports:

      - "5001:5000"

    depends_on:

      - redis

    environment:

      - REDIS_HOST=redis

    volumes:

      - ./static:/app/static

  redis:

    image: redis:latest

    ports:

      - "6379:6379"

    volumes:

      - redis-data:/data


volumes:

  redis-data:
Running the Application
To run the application, follow these steps:
- Clone the repository:
cd laptop-monitor #at the root of you project where we have the docker compose file
- Build and start the containers:
docker-compose up --build
- Access the dashboard:
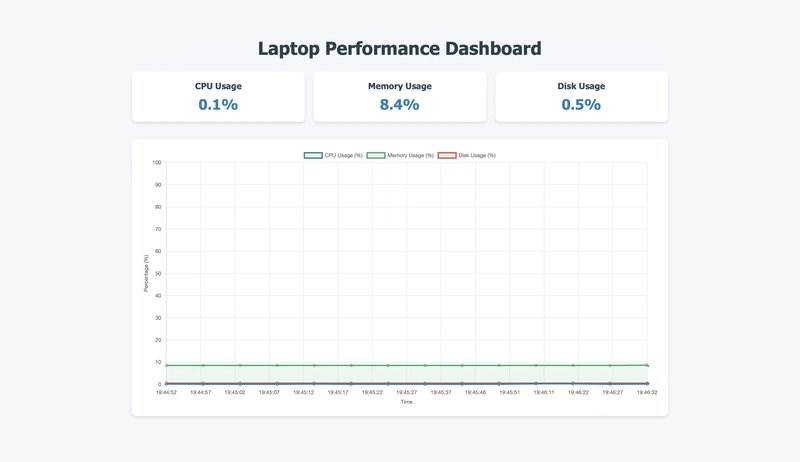
Open your web browser and navigate tohttp://localhost:5001
Conclusion
This laptop monitoring project serves as an excellent refresher for Python Flask development while incorporating modern development practices like containerization and real-time data handling. The combination of Flask's simplicity and Redis's powerful data handling capabilities creates a robust solution for system monitoring.
The project demonstrates several key concepts:
- Building a Flask web application
- Real-time data handling with Redis
- Docker containerization
- Frontend development with Chart.js
- System metrics monitoring with psutil
If you encounter any challenges while setting up or running the project, feel free to reach out in the comments section below. Your feedback and questions are valuable for improving this tutorial and helping others in the community.
Link to the code on github