



Originally published at https://www.nocobase.com/en/tutorials/project-tutorial-task-dashboard-part-1.
Dear friends, We’ve finally reached the long-awaited chapter on visualization! In this chapter, we’ll explore how to quickly zero in on the information we truly need amidst the clutter. As managers, we mustn’t lose our way in the complexity of tasks! Let’s tackle task statistics and information display together with ease.
9.1 Focus on Key Information
Our goal is to gain a quick overview of team tasks, highlighting those we are responsible for or interested in, without being overwhelmed by unnecessary data.
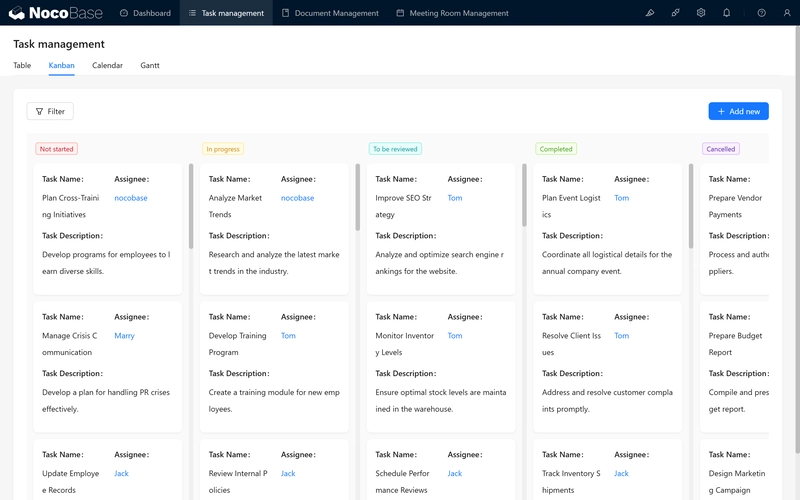
Let’s start by creating a team task statistics chart.
9.1.1 Create a Chart Block
With a new page:
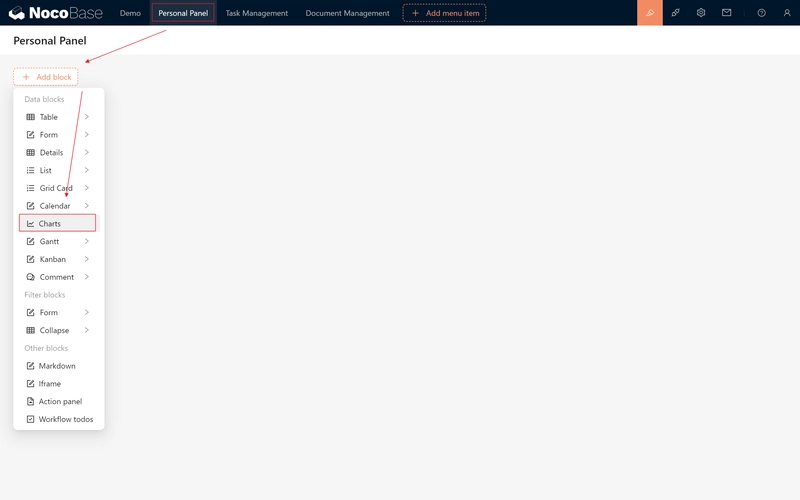
1.Create a New Chart Data Block. (Within this main block, you can build multiple charts.)
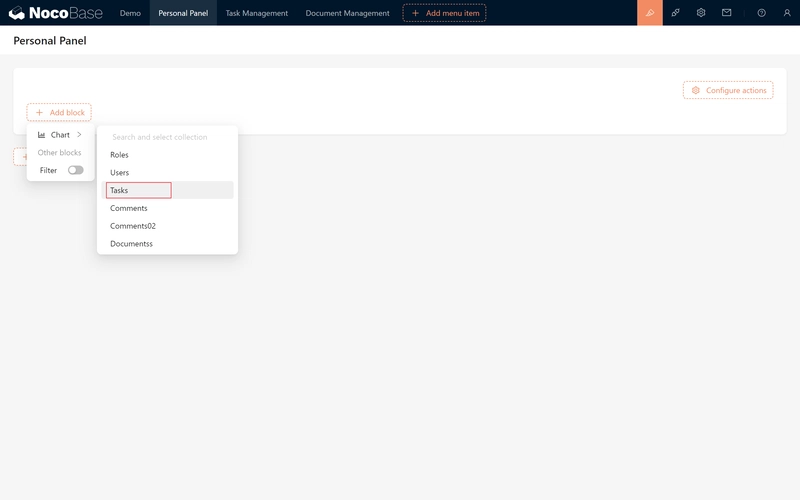
2.Select the Target Table: Task Table. Then proceed to chart configuration.
9.1.2 Configure Task Status Statistics
If we want to count the number of tasks in different states, what should we do? First, we have to process the data:
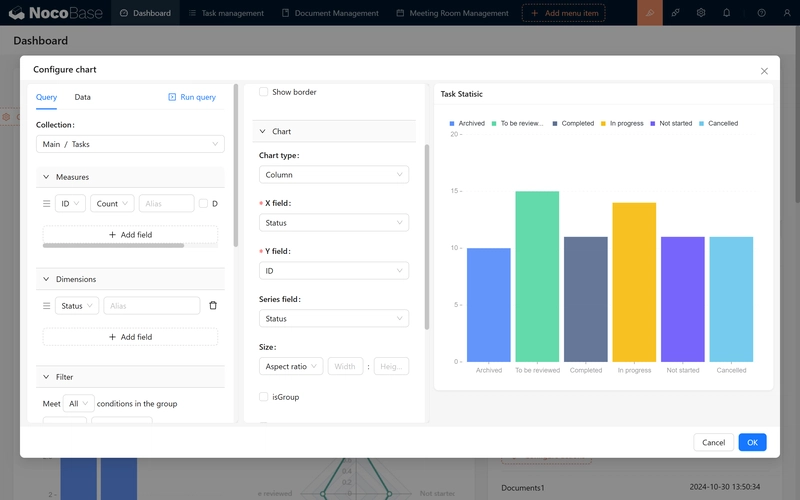
- Measures: Choose a unique field, such as the ID field to count.
- Dimensions: Group data by status.
Next, Chart Configuration:
1.Select a bar or column chart.
2.Set the X field to "Status" and the Y field to "ID."
(Tip: Remember to choose the "Status" in dimension fields for better visual distinction.)
9.1.3 Multi-Dimensional Statistics: Tasks Per Person
Want to view task counts per person and their statuses? Use dual dimensions by adding the "Assignee/Nickname" dimension.
1.Click "Run Query" in the top-left corner.
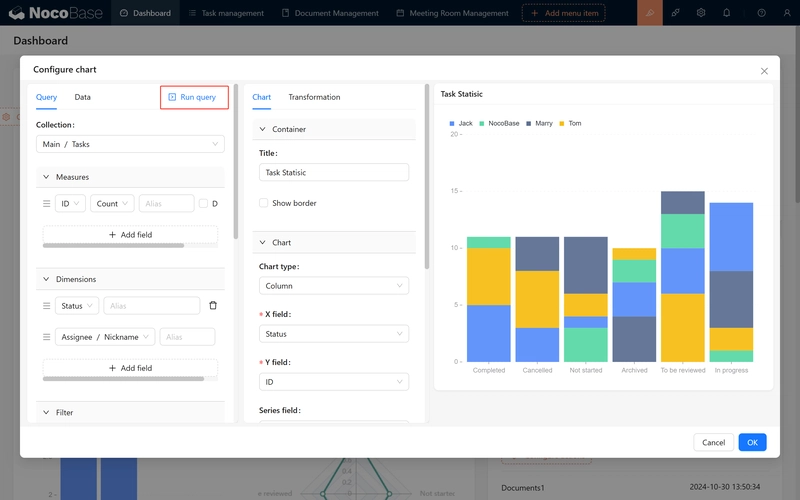
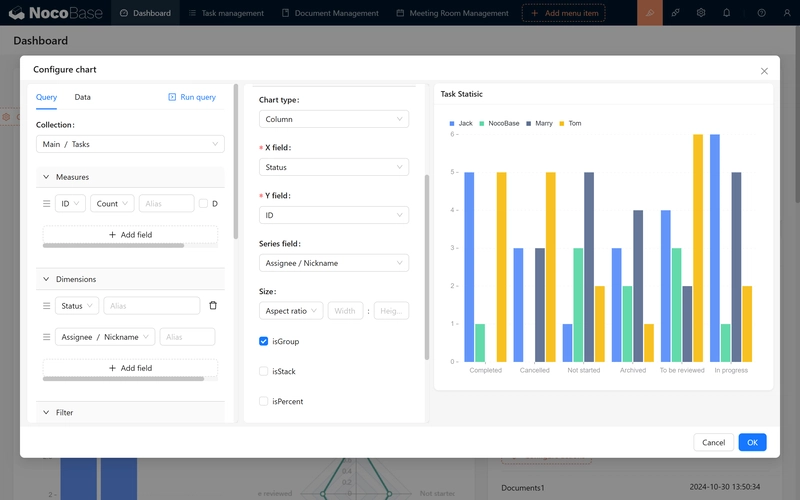
2.If the result isn't what you expected, select "isGroup" to display a comparative breakdown of tasks by assignees.
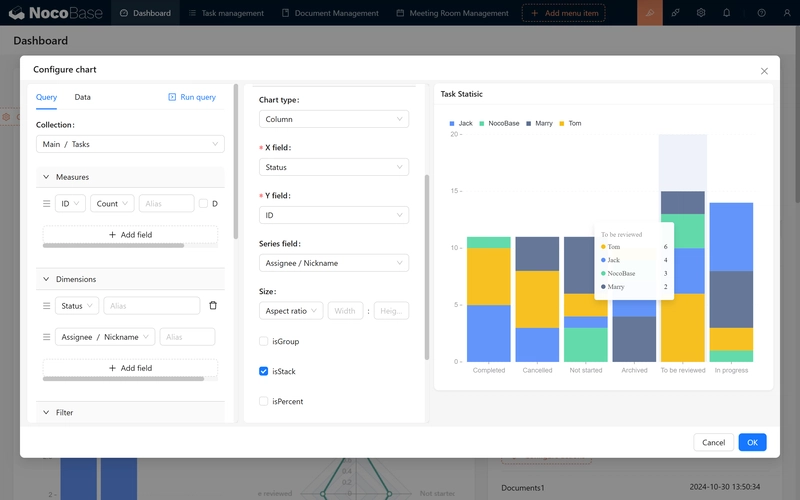
- Meanwhile, if you want to display the overall number of stacked, you can choose “isStack”. In this way, we can see the percentage of tasks for each person + the overall task status!
9.2 Data Filtering and Dynamic Display
9.2.1 Configure Data Filters
Of course, we can further remove the “Canceled” and “Archived” data, just remove these two options in the left filter conditions, I believe you are very familiar with these conditions!
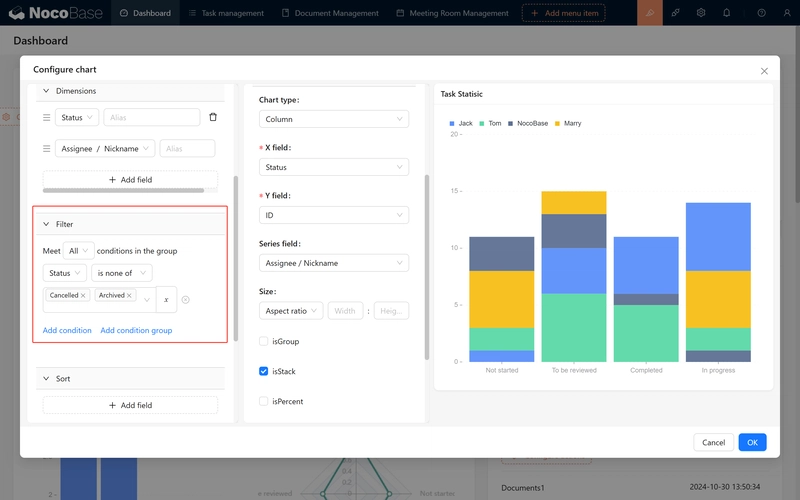
Once filtered, click confirm, exit configuration, and your first chart is ready!
9.2.2 Duplicate Charts
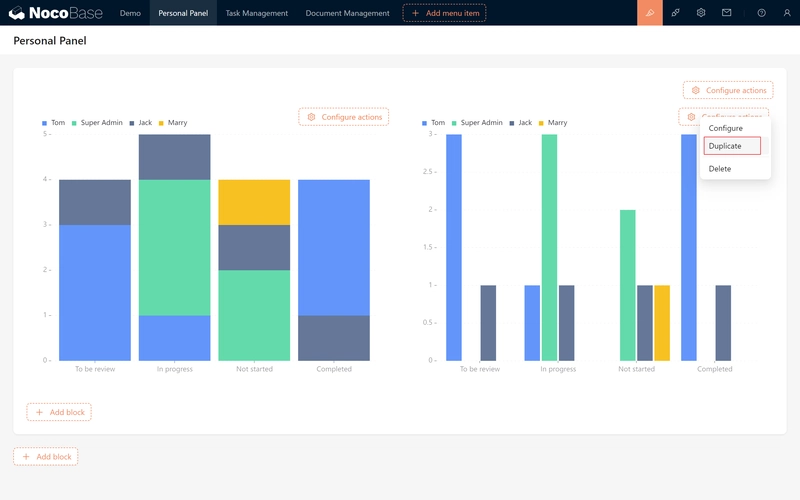
Need both "isGroup" and "isStack" charts without starting from scratch? Duplicate your chart:
- Click the copy icon on the top-right of your first chart block.
- Slide the wheel down, the second chart has appeared, drag and drop it to the right, remove the “isStack” configuration, change to “isGroup”.
9.2.3 Dynamic Filtering
For interactive filtering of task data:
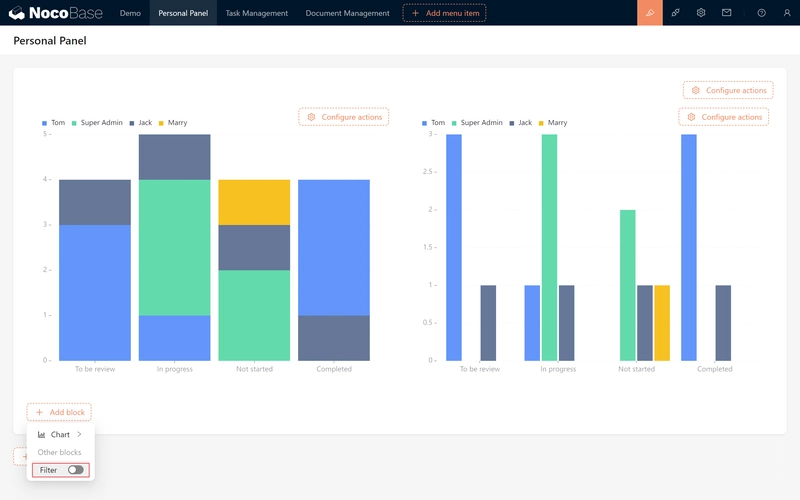
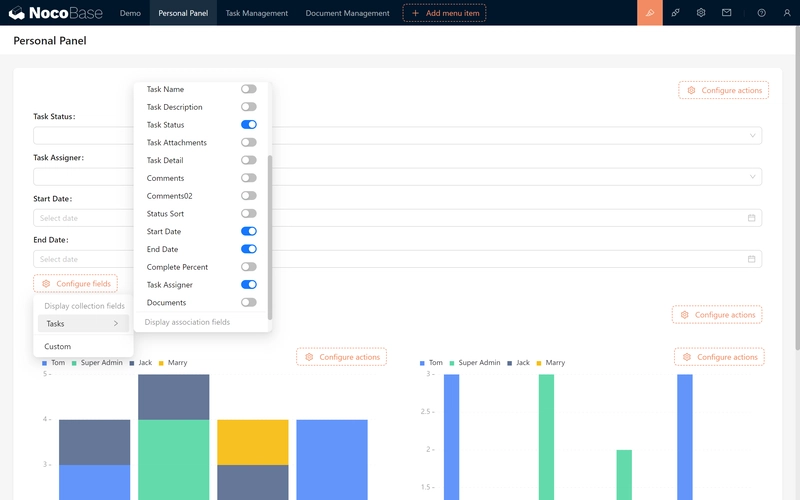
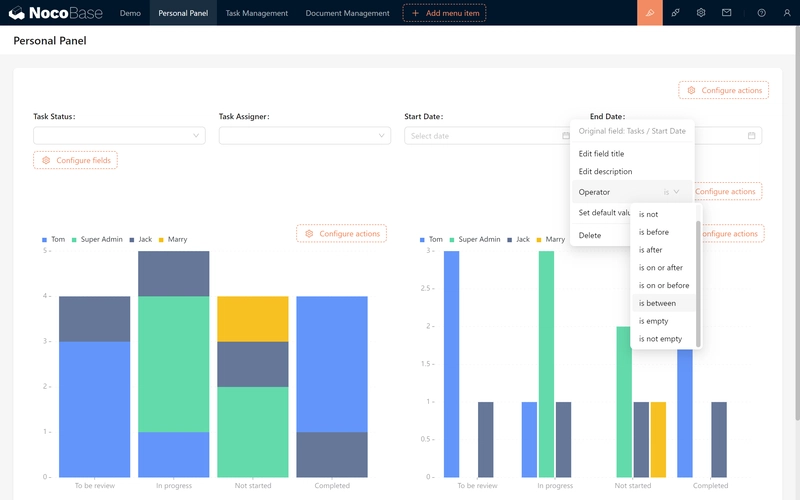
Of Course! We open "Filter" below the chart data block, and the filter box has appeared above. We show the desired fields and set the filtering conditions for the fields. (For example, change the date field to "between")
9.2.4 Creating Custom Filter Fields
What if we also want to include “Canceled” and “Archived” data in special cases, and support dynamic filtering and set filtering defaults?
Let's create a customized filter field!
You can easily configure filters by selecting fields from associated data tables or creating custom fields.(Only available within chart block)
Options include editing field titles, descriptions, operators, and setting default values (e.g., the current user or date), making filters more tailored to your needs.
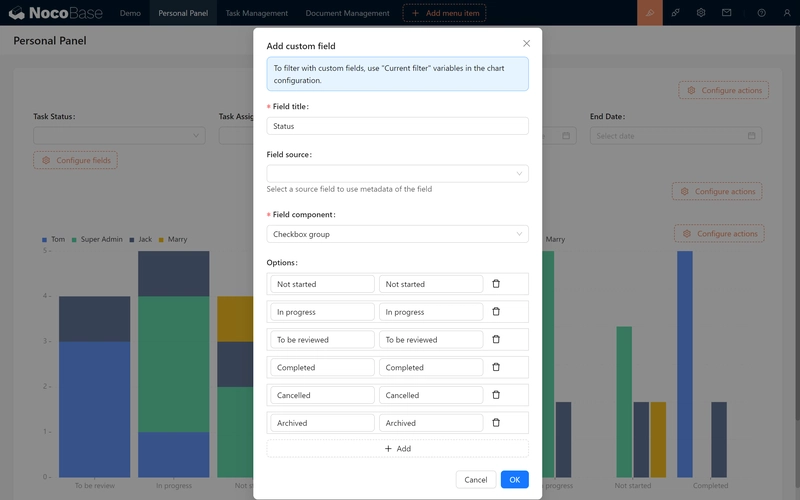
- fill in the title of the “Status”.
- Leave the Source field blank.
- Select “Checkbox” for the component.
- Options are filled in according to the value of the Status attribute when the database is created (note that the order of attributes here is Option Label - Option Value).
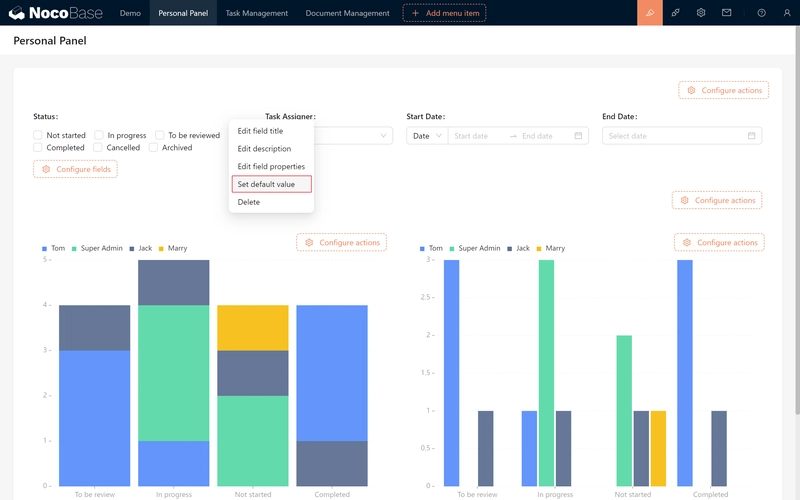
Create successfully, click “Set Default Value”, select the option we need.
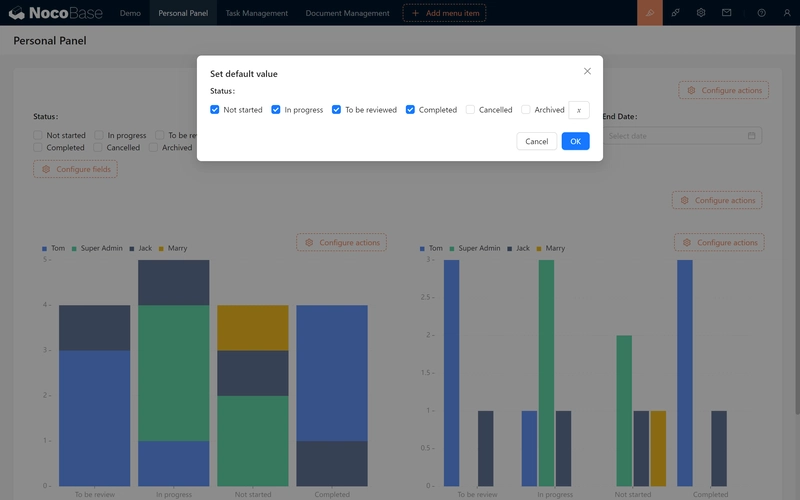
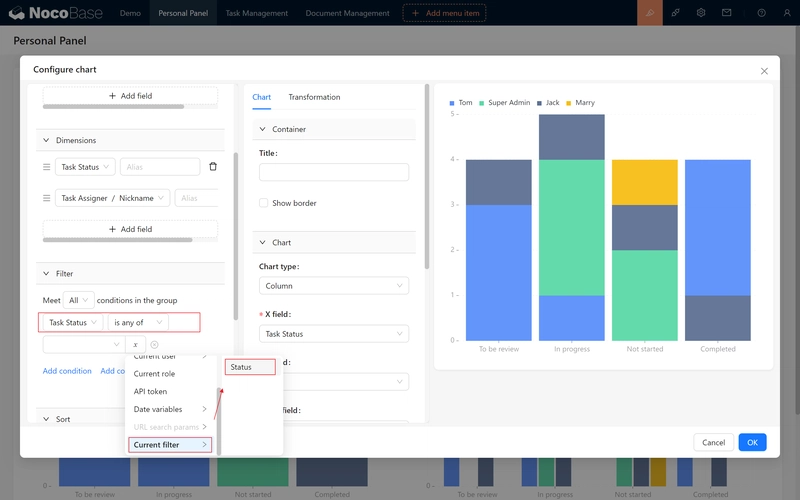
After setting the default value, go back to the chart configuration, change the filter condition to “Status - is any of - Current filters / status”, and then confirm! (Both charts should be changed.)
Done, let's filter test, the data has been perfectly rendered.
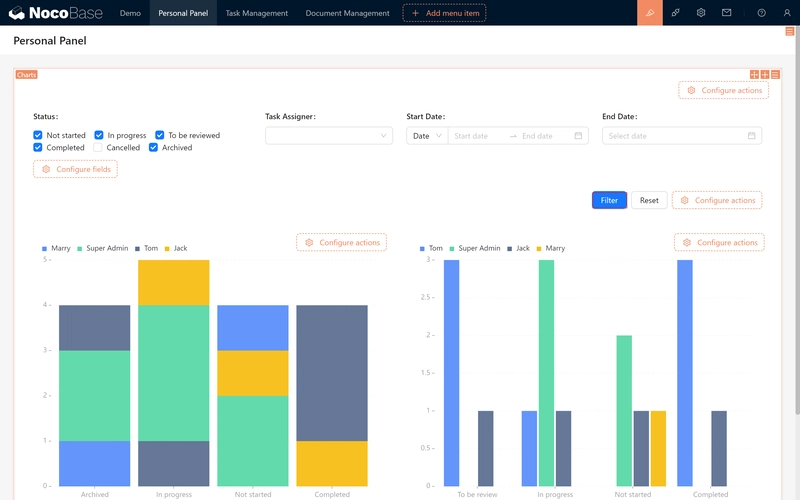
9.3 Dynamic Links and Task Filtering
A powerful feature: clicking on a statistic to jump to filtered tasks. Let’s make it happen.
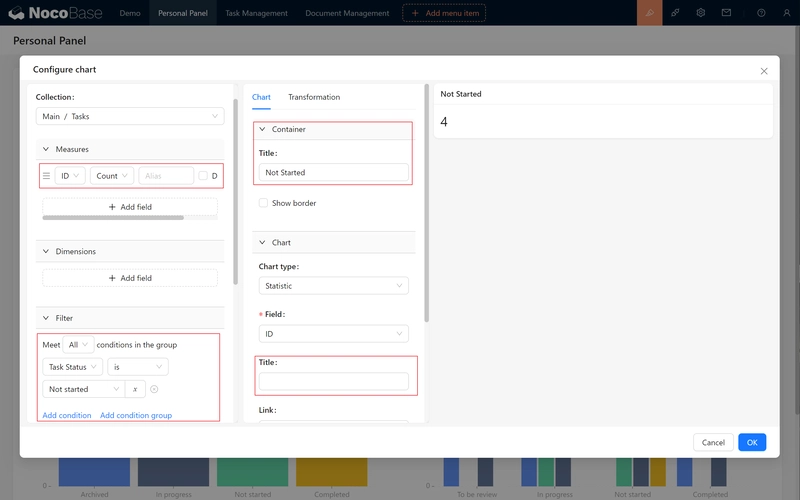
9.3.1 Using the "Not started" Example, Create a Statistical Chart
- Set the Measures to ID - Count.
- Add a filter: Status = "Not Started"
- Set container name to "Not Started", Chart Type to "Statistic", and leave chart name blank.
The unstarted stats have been successfully displayed. Let's make five copies by state and drag them to the top.
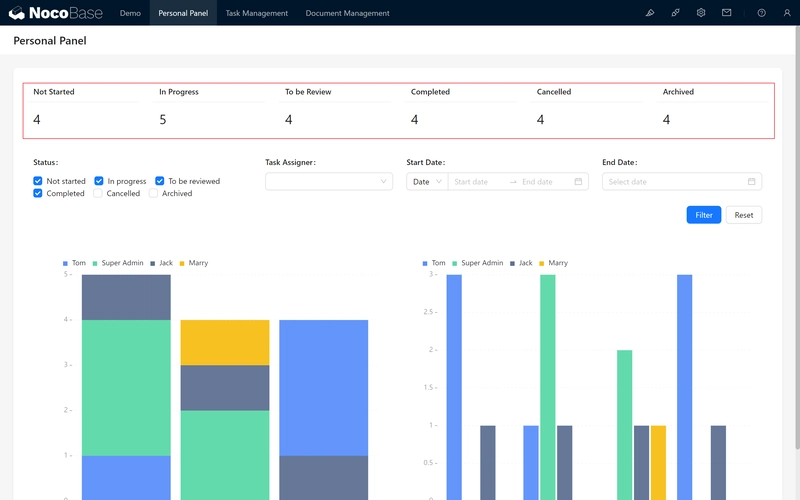
9.3.2 Configure Link Filtering
1.Go back to the page containing the task management table block and observe the link format in the browser's address bar (usually something like http://xxxxxxxxx/admin/0z9e0um1vcn).
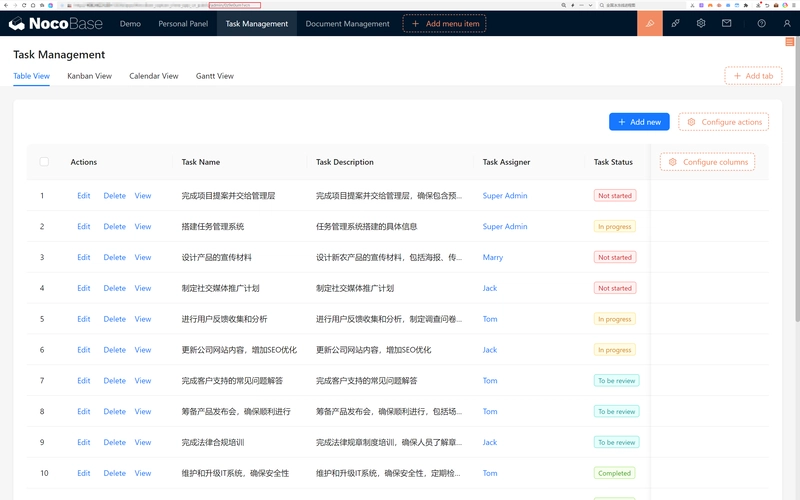
Assume xxxxxxxxx represents your website domain, and /admin/0z9e0um1vcn is the path. (We only need to find the last /admin.)
2.Copy part of the link:
- We need to perform a link jump. To do this, we first extract a specific portion of the link.
- Copy from the text after
admin/(excludingadmin/) to the end of the link. For example, in this case, the portion to copy is:0z9e0um1vcn.
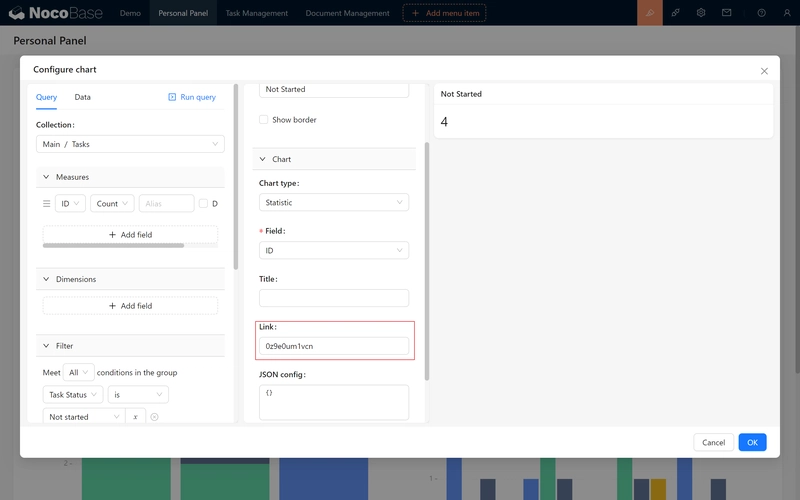
Move the cursor over "Not Started," and you’ll notice the cursor changes to a hand icon. Click on it to jump successfully.

3.Configure the chart link:Now, let’s add a filter parameter to the link. Do you remember the database identifier for task status? We’ll need to append this parameter to the end of the link to further filter tasks.
- Add
?task_status=Not startedto the end of the link. Your link will then look like:0z9e0um1vcn?task_status=Not started.
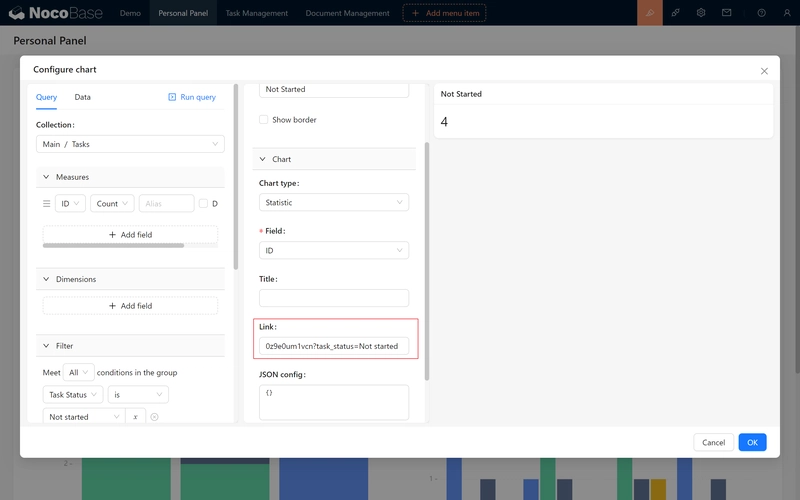
Understanding URL Parameters: When adding parameters to a URL, there are formatting rules to follow:
Question mark (?): Indicates the start of the parameters.
Parameter name and value: Format asparameter_name=parameter_value.
Multiple parameters: Use the&symbol to connect them. For example:
http://xxxxxxxxx/admin/hliu6s5tp9x?status=todo&user=123.
In this example,useris another parameter name, and123is its corresponding value.
4.Go back to the page, click to jump, and you’ll find the desired parameters are now included in the URL. (Like http://xxxxxxxxx/admin/0z9e0um1vcn normally)
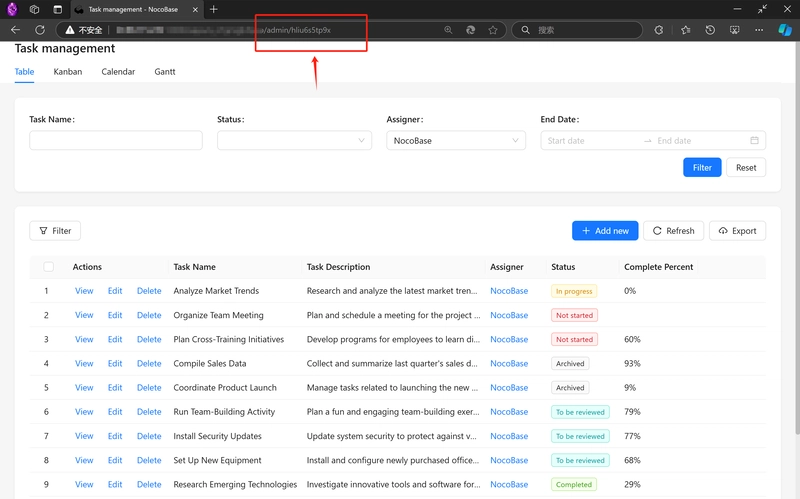
9.3.3 Associating URL Filter Conditions
Why hasn't the table changed yet? Don't worry, let's finish the last step together!
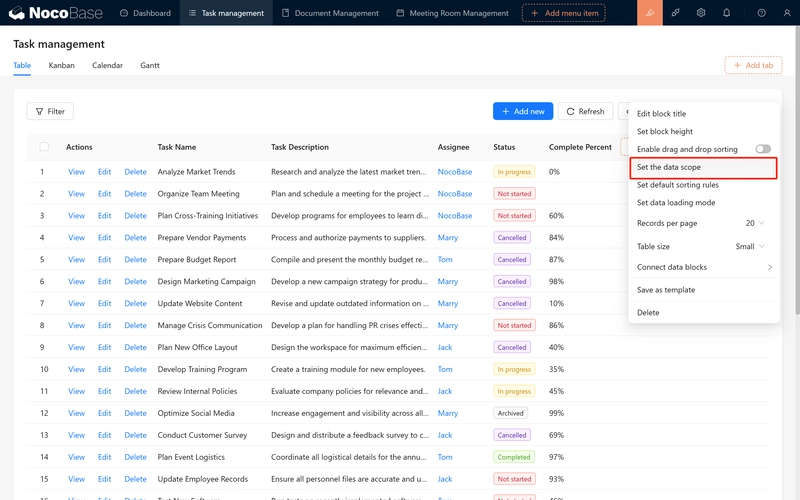
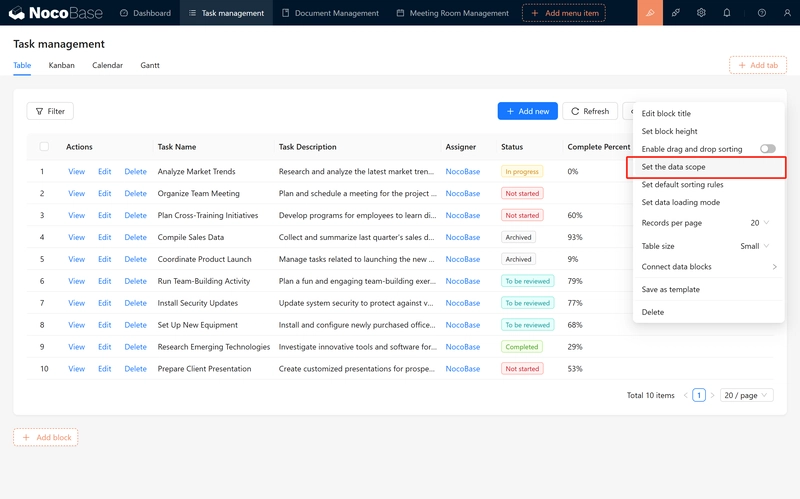
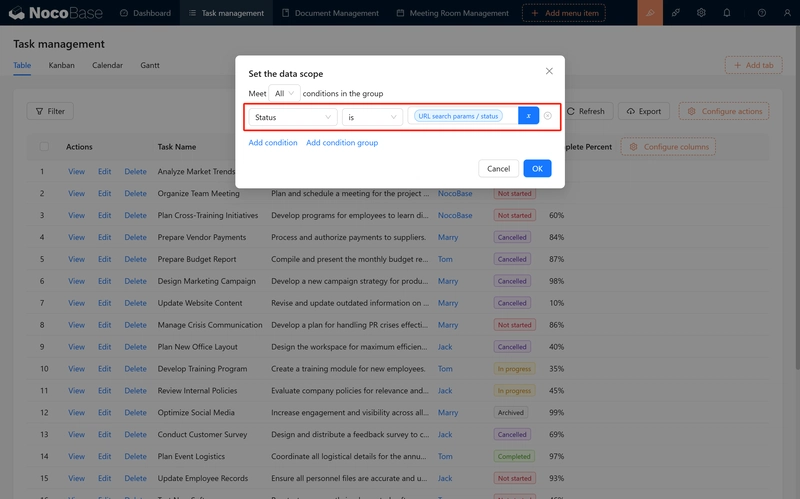
- Go back to the form block configuration and click on “Set data range”.
- Select “Status” equal to “URL search params / status”.
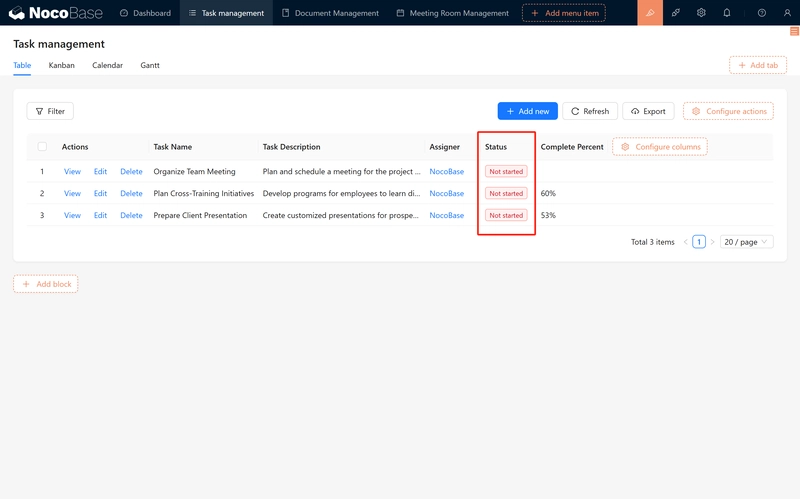
Click on “Confirm” and the filtering is successful!
9.4 Data Visualization: Stunning Charts
Data Visualization: ECharts (Commercial Plugin)
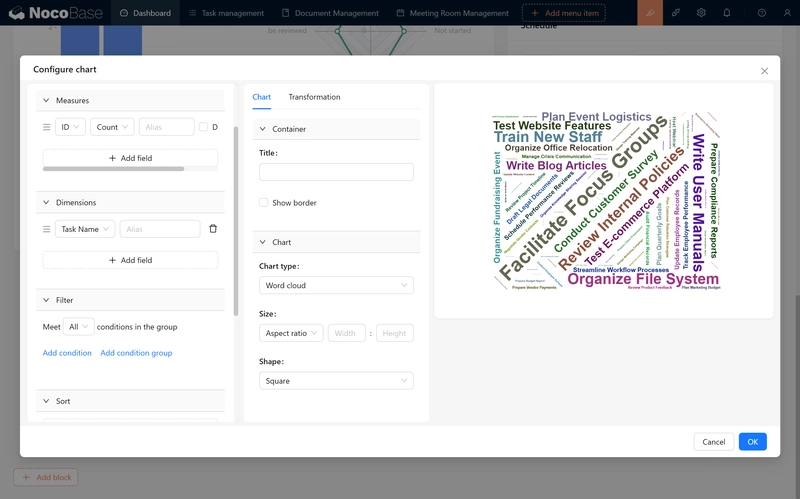
ECharts offers more advanced and customizable configuration options, such as "Line Chart (Multi-Dimension)," "Radar Chart," "Word Cloud," and more.
If you want to access more chart configuration options, you can enable "Data Visualization: ECharts"!
9.4.1 Quickly Configure a Stunning Radar Chart
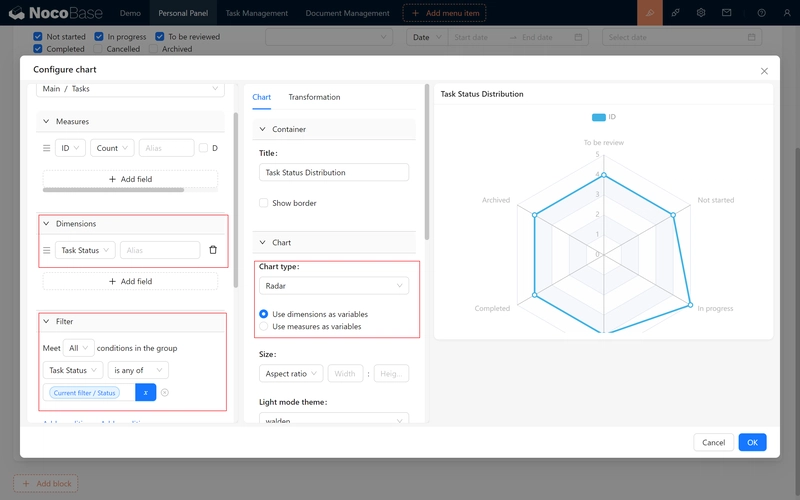
If you notice data overlap, remember to adjust the size or radius to ensure that all information is clearly displayed!
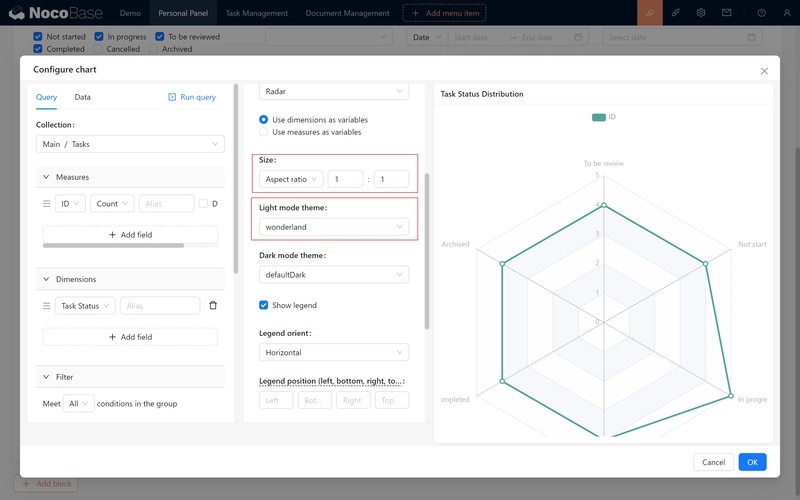
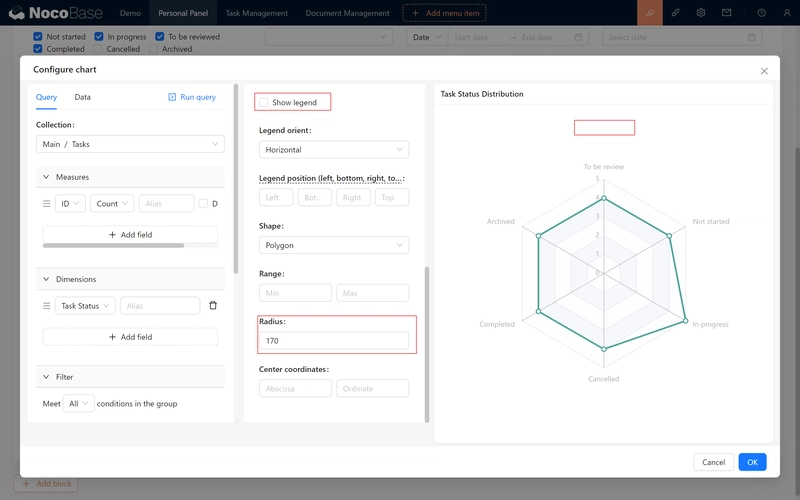
After configuration, simply drag and adjust the display style to complete!
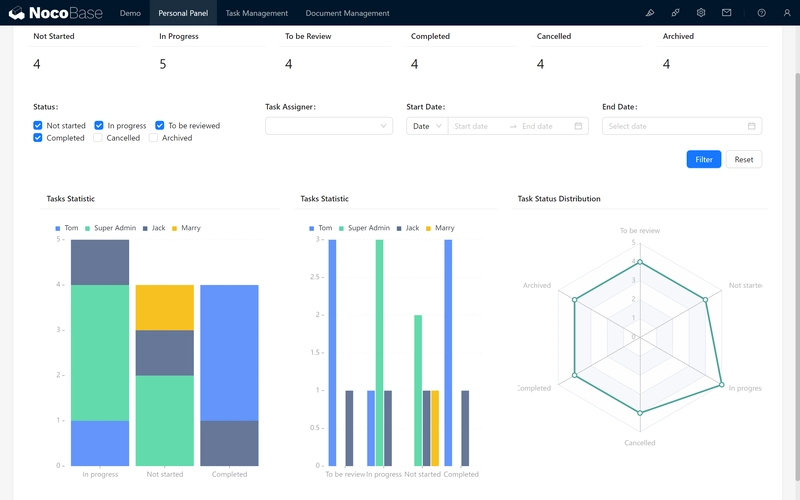
9.4.2 More chart containers
Here are more charts for you to explore.
Word Cloud
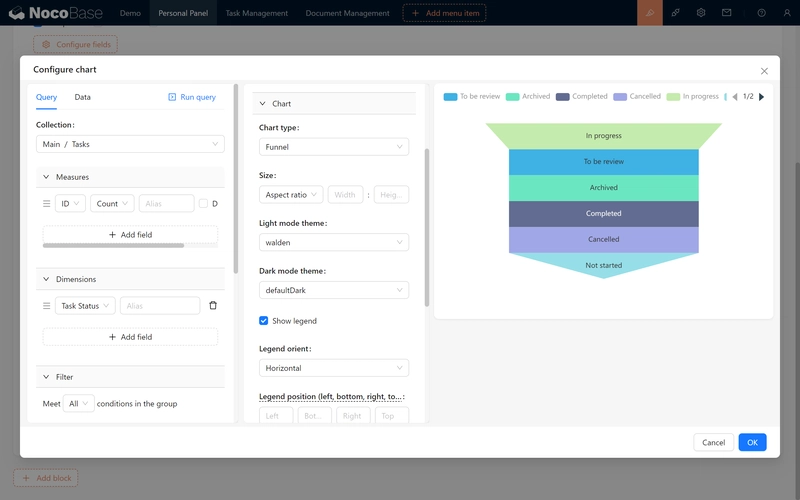
Funnel
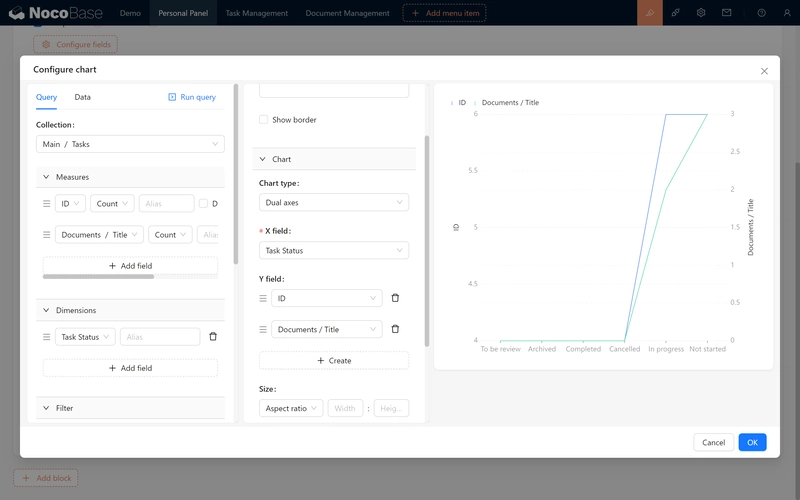
Multiple Indicators (Dual Axes, Echarts Line)
For bi-axial charts you can add more indicators
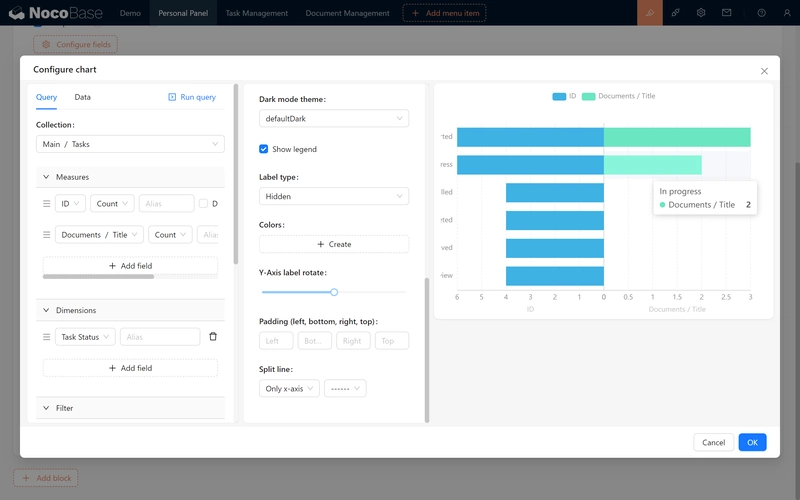
Diverging bar
9.5 Mini Challenge
1.Configure URL parameters for the remaining statuses: "In Progress," "Pending Review," "Completed," "Canceled," and "Archived."
2.Set up a "Assignee" multi-select field, just like the "Status" field, with a default value of the current user’s nickname.
Looking forward to seeing you in the next chapter!
Keep exploring and creating endless possibilities! If you encounter any issues along the way, don’t forget to check the NocoBase Documentation or join the NocoBase Community for discussions and support.