



As part of my final project for the DE Zoomcamp 2025 cohort by DataTalksClub, I set out to build an end-to-end batch data pipeline to process and analyze over 1.1 million Citi Bike trips from NYC’s 2024 dataset.
The goal? Uncover trends in urban mobility and rider behavior to support bike-sharing operations and inform city planning.
In this blog post, I’ll walk you through the project’s motivation, architecture, implementation, insights, challenges, and what I learned along the way.
Why Citi Bike Data?
Citi Bike, New York City’s bike-sharing system, generates millions of trip records each month, capturing detailed data on rides, stations, and user behavior. This data is a goldmine for understanding urban mobility patterns, but without an automated pipeline, processing these large datasets and extracting actionable insights is a daunting task. My project aimed to solve this by building a scalable batch pipeline to ingest, store, transform, and visualize Citi Bike’s 2024 trip data.
Key Questions to Answer
- How does Citi Bike usage vary over time, and what seasonal patterns emerge in 2024?
- What’s the breakdown of rides between electric and classic bikes, and how does this impact operations?
- How do ride patterns differ between member and casual users?
- Which stations are the most popular starting points, and what does this suggest about urban mobility in NYC?
- What’s the average trip duration, and how can this inform bike maintenance or rebalancing strategies?
Project Overview
The NYC Bike Rides Pipeline is a batch data pipeline that processes Citi Bike 2024 trip data, stores it in a data lake, transforms it in a data warehouse, and visualizes key metrics through an interactive dashboard. Built entirely on Google Cloud Platform (GCP), the pipeline leverages modern data engineering tools to automate the process and deliver insights.
Tech Stack
- Cloud: GCP (Google Cloud Storage for the data lake, BigQuery for the data warehouse)
- Infrastructure as Code (IaC): Terraform to provision infrastructure
- Orchestration: Apache Airflow (running locally via Docker)
- Data Transformations: dbt Cloud for modeling and transformations
- Visualization: Looker Studio for the dashboard
Pipeline Architecture
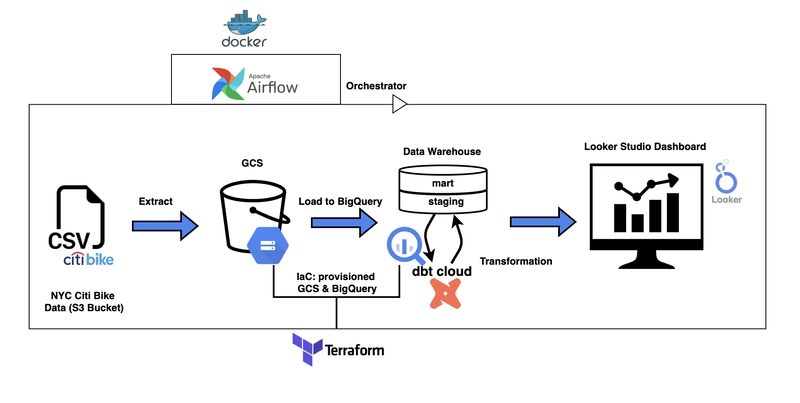
The pipeline follows a batch processing workflow, orchestrated end-to-end using Apache Airflow. Here’s a breakdown of each stage:
Data Ingestion:
I sourced the Citi Bike 2024 trip data (CSV files) from a public S3 bucket. The data is downloaded and uploaded to a Google Cloud Storage (GCS) bucket namednaza_nyc_bike_rides, which serves as the data lake.Orchestration:
Apache Airflow, running locally in a Docker container, orchestrates the pipeline. A custom DAG (etl.py) manages the monthly ingestion, loading, and transformation steps, ensuring the pipeline runs smoothly for each month of 2024.Data Warehouse:
Raw data is loaded from GCS into Google BigQuery’s staging dataset (nyc_bikes_staging). To optimize query performance, I partitioned the tables by thestarted_attimestamp and clustered them bystart_station_id. After transformation, the data is loaded into the production dataset (nyc_bikes_prod).Transformations:
Using dbt Cloud, I transformed the raw data into a production-ready dataset. This involved cleaning (e.g., removing records with null values in critical fields likestarted_atandrideable_type), aggregating (e.g., rides by month), and modeling the data for analysis.Visualization:
The final dataset innyc_bikes_prodis connected to Looker Studio, where I built an interactive dashboard to visualize key metrics like total rides, rideable type breakdown, and top start stations.Infrastructure as Code (IaC):
I used Terraform to provision the GCS bucket (naza_nyc_bike_rides) and BigQuery datasets (nyc_bikes_stagingandnyc_bikes_prod), ensuring reproducibility and scalability.
Architecture Diagram
Implementation Details
Setting Up the Infrastructure with Terraform
I started by defining the infrastructure in Terraform, which allowed me to provision the GCS bucket and BigQuery datasets as code. The terraform/ directory containsmain.tfandvariables.tf, where I specified theGCP project ID,region, and resource names. Running terraform init and terraform apply set up the infrastructure in minutes, ensuring consistency across environments.Orchestrating with Apache Airflow
Airflow was the backbone of the pipeline, automating the ingestion, loading, and transformation steps. I containerized Airflow using Docker (docker-compose.yml) and configured it with environment variables in a.envfile (e.g., GCP project ID, bucket name). The DAG (etl.py) in the dags/ folder handles the monthly batch processing, downloading CSV files, uploading them to GCS, and loading them into BigQuery.
One challenge I faced was initially attempting to use Google Cloud Composer for Airflow, but setup issues led me to switch to a local Airflow instance via Docker. This turned out to be a blessing in disguise, as it gave me more control over the environment and simplified debugging.
Transforming Data with dbt Cloud
With the raw data in BigQuery’snyc_bikes_stagingdataset, I used dbt Cloud to transform it into a production-ready dataset (nyc_bikes_prod). My dbt models handled:
- Cleaning: Removing records with null values in critical fields.
- Aggregation: Calculating monthly ride counts, average trip durations, and user type breakdowns.
- Modeling: Creating tables optimized for analysis (e.g., rides by station, rideable type).
Running the dbt models was straightforward, and the resulting dataset was ready for visualization.
Visualizing Insights in Looker Studio
I connected Looker Studio to the nyc_bikes_prod dataset and built a dashboard titled NYC Bike Usage Insights (2024).
You can explore the dashboard here:Looker Studio link.
Challenges and Solutions
Challenge 1: Airflow Setup with Cloud Composer
Initially, I planned to use Google Cloud Composer for Airflow, but I ran into setup issues, including dependency conflicts and longer-than-expected provisioning times. I pivoted to running Airflow locally with Docker, which gave me more control and faster iteration cycles. This taught me the importance of flexibility when working with cloud-managed services.
Challenge 2: Handling Large Datasets in BigQuery
The Citi Bike dataset, with over 1.1 million records, required careful optimization in BigQuery. I fine-tuned performance by partitioning tables by the started_at timestamp and clustering by start_station_id, which significantly reduced query costs and improved performance for downstream analyses.
Challenge 3: Data Quality Issues
Some records had null values in critical fields like started_at, rideable_type, and start_station_name. I addressed this in dbt by filtering out these records during transformation, ensuring the dashboard reflected accurate insights.
What I Learned
While I’ve worked with tools like BigQuery, Airflow, and Terraform before, this project deepened my understanding of how to apply them in a real-world context:
Tool Integration: I gained a deeper appreciation for integrating a full suite of tools (GCP, Airflow, dbt, Terraform) into a cohesive, scalable pipeline. Each tool has its strengths, and orchestrating them effectively is key to a successful project.
Performance Optimization: Fine-tuning BigQuery for large datasets with partitioning and clustering was a great exercise in balancing cost and performance, especially for a dataset of this scale.
Best Practices in Orchestration and IaC: I refined my approach to orchestrating complex workflows with Airflow and provisioning infrastructure with Terraform, focusing on modularity and reproducibility.
Data Storytelling: The project reinforced the power of data storytelling—turning raw trip data into actionable insights about urban mobility highlighted the importance of a solid pipeline as the foundation for impactful visualization.
Future Improvements
This project is a strong foundation, but there are several ways to take it further:
- CI/CD Pipeline: Implement a CI/CD pipeline using GitHub Actions to automate testing and deployment of the DAGs and Terraform configurations.
- Real-Time Data: Explore streaming ingestion for real-time Citi Bike data, enabling live dashboards and more timely insights.
- Advanced Analytics: Add predictive models (e.g., bike demand forecasting) or anomaly detection (e.g., unusual station usage patterns) to provide deeper insights.
Conclusion
Building the NYC Bike Rides Pipeline for DE Zoomcamp 2025 was an incredible learning experience. It allowed me to apply my data engineering skills to a real-world problem, from ingestion to visualization, while uncovering meaningful insights about urban mobility in NYC. The project also highlighted the importance of automation, optimization, and storytelling in data engineering.
You can explore the full project on GitHub.
I’d love to hear your feedback or ideas for collaboration—feel free to reach out on LinkedIn or email me at [email protected].
A huge thank you to Alexey Grigorev, the DataTalksClub team, and the DE Zoomcamp community for an amazing program that pushed me to grow as a data engineer.
Here’s to more data adventures! 🚀
SOCIAL SHARE CARD GENERATOR