



The beginning
Over the past few months, I’ve realized that one of the things that bothers me most as a dev is not knowing when one of my services goes down.
It might sound silly, but it’s frustrating to find out hours later — or worse, from someone else.
I’ve tried a few well-known monitoring tools, and while they do work, I always felt like they were doing way too much for something that should be simple:
"Is the service up or not?"
That’s when I decided to build something of my own. Nothing too ambitious at first — I just wanted a minimal solution that could notify me quickly, without huge dashboards or 50 different settings.
And that’s how ServiceIsUp was born.
It started as a small side project out of necessity, but ended up growing more than I expected.
In this post, I just want to share how it started, what it does today, and maybe hear what you would’ve done differently if it were your project.
A little after the beginning
The very first version of ServiceIsUp was literally just a script running on a cron job that pinged a few URLs and sent me a message on Telegram if something failed. Rough and functional.
Like this
class Controller:

    def __init__(self, location):

        # query batch size

        self.query_limit = 500

        # list size of messages to send to broker

        self.messages_list_size = 100


        self.location = location

        self.cache_lock_key = f'query_lock_controller_{self.location.name}'

        self.cache_lock_timeout = 60

        self.lock_time = timezone.now()


    def send_messages(self, messages):

        try:

            broker_conn = Broker(

                broker_host=env.broker_host,

                broker_port=env.broker_port,

                broker_user=env.broker_user,

                broker_pass=env.broker_pass

            )

        except Exception as e:

            raise Exception(f"Error to init broker connection: {e}")


        broker_conn.connect()

        for message in messages:

            message_json = json.dumps(message['message'])

            broker_conn.set_queue(message['queue'])

            broker_conn.send_message(message_json)

        broker_conn.close()
But as I kept using it, I realized there was room to make it look nicer. Simple things, like:
Setting up multiple services easily.
Seeing the check history.
Having a minimal interface (just the essentials).
Choosing where I want to get alerts (email, Telegram, WhatsApp...).
And that’s when the fun began—turning my little project into something usable by other people, not just me.
I created a basic dashboard, set up a simple API, added an authentication system... and without even realizing it, I ended up with a mini SaaS 😅
Today, the main flow it basically this:
You register a site or endpoint (HTTP/HTTPS).
Set how often you want to check (e.g., every minute).
Choose how you want to be notified (email, Telegram, etc.).
Choose the status you expect to be returned(e.g., 201, 307, 404...)
and there you go
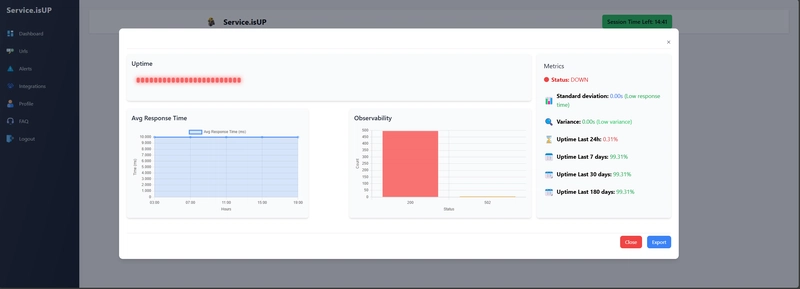
Nothing revolutionary, I know—but for anyone who just wants to know if the service is up or down, it works. And fast.
Oh, and the best part: since I built it, I know exactly where to tweak things if something breaks (which, in the world of external tools, isn’t always that simple).
But wait a minute, you're probably wondering "Why would anyone use this when they have Prometheus, Grafana and Zabbix free to use?"
Well, that's a fair question! Those tools are awesome — they're powerful, highly customizable, and great for complex setups. But here's the thing: sometimes, you just don’t need all that firepower. Sometimes, all you need is a simple solution to check if your service is up and running, without diving into detailed metrics or setting up a whole infrastructure.
Imagine this: You want to know if your website or API is online, and you'd like an alert if something goes wrong. You don't need dashboards with CPU usage, memory stats, or latency graphs. You just want to know, ‘Is it working? Yes or no?’ That’s where my system comes in. It’s straightforward, no fluff, and it doesn’t come with the complexity of setting up and maintaining an entire monitoring ecosystem with tons of GB of data. It’s like choosing a Swiss Army knife over a cannon. Both can do the job, but you’re not going to use a cannon to hit a target 10 feet away, right? Since ServiceIsUP is 100% cloud-based, you don't have to worry about RAM, storage, threads, race conditions, you can focus only in your business.
*hint: *If you're dealing with complex, large-scale systems, sure, Prometheus, Grafana, and Zabbix are fantastic.

For example, instead of setting up a new server for observability with Prometheus, Grafana and HAproxy, dealing with storage, compressing query backups and sending them to S3 or another equivalent storage service, this user simply registered his 12 URLs in a few minutes without writing a single line of code and is now ready to view response time and uptime metrics, receive alerts from various channels with personalized messages when a service fluctuates, has a higher than normal response time or goes down.
Of course, other solutions are extreme scalable, but this scalability requires considerable effort to set up and maintain. ServiceIsUp provides the scalability you need to add new services, users and alerts as you grow, but without the need to manage clusters or load balancing. You can easily add and monitor new endpoints or services without significant effort.
The user have the freedom to create as many alerts as he want, including any message, whether it be an instruction message or delegating who or which team will deal with the situation. Use your creativity within the context you are in.

You can also choose who you receive that alert.

Conclusion
So, whether you're managing a small personal project or just want a straightforward solution to keep an eye on your services, ServiceIsUp is designed to save you time and effort without the need for complex setups. If you don’t want to deal with the overhead of configuring large monitoring systems, and just need quick, reliable alerts — this is the tool for you.
If you're tired of getting lost in dashboards and configurations, or if you just want to make sure your service stays up without all the fuss, give ServiceIsUp a try. It’s simple, efficient, and built to help you focus on what really matters: your business.
Ready to get started? Head over to start. Set up your first alert in minutes — no server setup, no hassle.
You can also use the coupon code DEVTO to get $12 off your first 3 months, with access to all features.
SOCIAL SHARE CARD GENERATOR