



Monitoring your infrastructure is crucial for reliability and performance. In this article, we'll walk through a simple and effective monitoring stack using Docker Compose, featuring Prometheus for metrics collection, Grafana for visualization, and Node Exporter for exposing host metrics.
Project Structure
.

├── docker-compose.yml

├── prometheus.yml

└── provisioning/

    └── datasources/

        └── prometheus.yml
Understanding the docker-compose.yml File
Let's break down the main components of the docker-compose.yml file:
services:

  prometheus:

    image: prom/prometheus:v3.3.1

    container_name: prometheus

    ports:

      - "9090:9090"

    volumes:

      - ./prometheus.yml:/etc/prometheus/prometheus.yml

      - prometheus_data:/prometheus

    networks:

      - monitoring


  grafana:

    image: grafana/grafana:12.0.0

    container_name: grafana

    ports:

      - "3000:3000"

    environment:

      - GF_SECURITY_ADMIN_PASSWORD=admin

    depends_on:

      - prometheus

    networks:

      - monitoring

    volumes:

      - ./provisioning/datasources:/etc/grafana/provisioning/datasources

      - grafana_data:/var/lib/grafana


  node_exporter:

    image: prom/node-exporter:v1.9.1

    container_name: node_exporter

    ports:

      - "9100:9100"

    networks:

      - monitoring


networks:

  monitoring:

    driver: bridge


volumes:

  prometheus_data:

    driver: local

  grafana_data:

    driver: local
Service Breakdown
Prometheus
- Uses the official Prometheus image.
- Exposes port
9090. - Mounts a local
prometheus.ymlconfig and a Docker volume for persistent data. - Connected to a custom
monitoringnetwork.
Grafana
- Uses the official Grafana image.
- Exposes port
3000. - Sets the admin password via environment variable.
- Depends on Prometheus (starts after Prometheus is up).
- Mounts provisioning files and a persistent data volume.
- Connected to the
monitoringnetwork.
Node Exporter
- Uses the official Node Exporter image.
- Exposes port
9100. - Connected to the
monitoringnetwork.
Networks and Volumes
- All services share the
monitoringbridge network. - Prometheus and Grafana use named volumes for data persistence.
- All services share the
Step-by-Step Guide
1. Clone the Repository
Github Link: https://github.com/rafi021/monitoring-stack-prometheus-grafana-node-exporter
git clone <your-repo-url>

cd <your-repo-directory>
2. Review and Edit Configuration
prometheus.yml: Make sure Prometheus is configured to scrape Node Exporter.
provisioning/datasources/prometheus.yml: Ensures Grafana automatically adds Prometheus as a data source.
The prometheus.yml file is the main configuration file for Prometheus. Here’s what each section does:
global:

  scrape_interval: 5s
global: Sets global configuration options.
scrape_interval: 5s: Prometheus will scrape (collect) metrics from all configured targets every 5 seconds.
scrape_configs:

  - job_name: 'node'

    static_configs:

      - targets: ['node_exporter:9100']  # This points to the Node Exporter container
scrape_configs: Defines the list of jobs (sets of targets) Prometheus should scrape.
job_name: 'node': Names this scrape job "node" (for Node Exporter).
static_configs: Specifies static targets for this job.
targets: ['node_exporter:9100']: Prometheus will scrape metrics from the Node Exporter container at port 9100.
Summary:
This config tells Prometheus to collect metrics from the Node Exporter container every 5 seconds.
This file provisioning/datasources/prometheus.yml is a Grafana data source provisioning configuration. It tells Grafana to automatically add Prometheus as a data source when Grafana starts.
apiVersion: 1
Specifies the version of the provisioning config format.
datasources:
A list of data sources to add.
name: Prometheus
The name that will appear in Grafana.
type: prometheus
Specifies the data source type (Prometheus).
access: proxy
Grafana will proxy requests to Prometheus (recommended for most setups).
url: http://prometheus:9090
The URL where Prometheus is accessible from within the Docker network (using the service name).
isDefault: true
Sets this data source as the default in Grafana.
Summary:
This file ensures that Prometheus is pre-configured as the default data source in Grafana, so you don’t have to add it manually.
3. Start the Stack
docker-compose up -d
This command will pull the required images and start all services in the background.
4. Access the Services
Prometheus UI: http://localhost:9090
Grafana UI: http://localhost:3000
- Default login:
admin/admin
- Default login:
Node Exporter Metrics: http://localhost:9100/metrics

Prometheus UI showing that the, node exporter endpoint is connected successfully.
5. Add Dashboards in Grafana
- Prometheus is already set as a data source.
- Import community dashboards or create your own to visualize Node Exporter metrics.

- Click + Create Dashboard

- Import Node Exporter Dashboards: There are pre-configured dashboards available for Node Exporter. You can go to Grafana Dashboards and search for Node Exporter Full Dashboard (ID: 1860), which will give you a comprehensive view of your system metrics.

- In the Grafana Dashboards section, search for Node Exporter Full dashboard. The Dashboard ID for Node Exporter Full is 1860.
- Enter 1860 in the Import via ID field and click Load.
- In the Prometheus drop-down, choose the Prometheus data source you just configured.
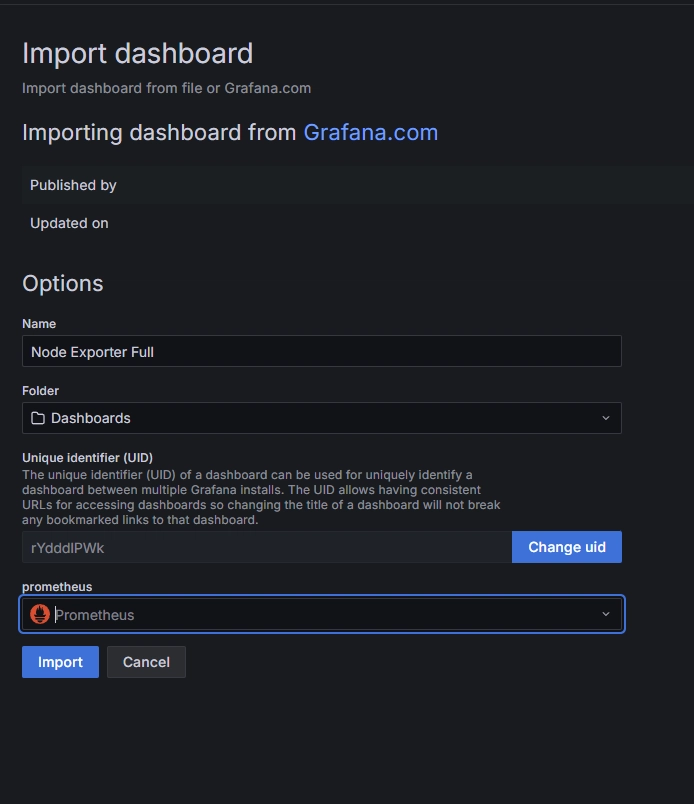
- Click Import.
- Verify the Dashboard:
- Once the dashboard is imported, you should see a comprehensive view of your Ubuntu server’s metrics, including CPU usage, memory usage, disk I/O, network statistics, etc.

6. Stopping the Stack
docker-compose down
This will stop and remove all containers, but your data will persist in the named volumes.
Tips & Troubleshooting
Customizing Prometheus Targets: Editprometheus.ymlto add more scrape targets.
Persisting Data: Data is stored in Docker volumes (prometheus_data,grafana_data).
Logs: Check logs with:
  docker-compose logs prometheus

  docker-compose logs grafana

  docker-compose logs node_exporter
Change Default Password: For security, change the Grafana admin password in production.
Conclusion
With just a few files and Docker Compose, you can have a powerful monitoring stack up and running in minutes. This setup is perfect for local development, testing, or even small production environments.
Happy Monitoring!
References: