In early 2019, we received a bug submission from a new researcher affecting the TP-Link TL-WR841N Router. While this vulnerability is still in disclosure phase, we would like to share lessons learned when we were vetting this submission.
TL-WR841N is an inexpensive ($18 USD) and very popular router on Amazon.com. It was one of the top 10 best-selling routers on Amazon.com at the time of the submission. Being a popular router, TP-Link has released multiple iterations on this device over a span of several years.
and tutorials covering how to set up hardware debugging interfaces for old iterations of this device exist on the Internet. However, the number of tutorials on newer iterations has tapered because OpenWRT has dropped support for later revisions of this device.
In this blog post, we will be using the TL-WR841Nv14 router and outline the steps required to set up remote debugging on this device with .
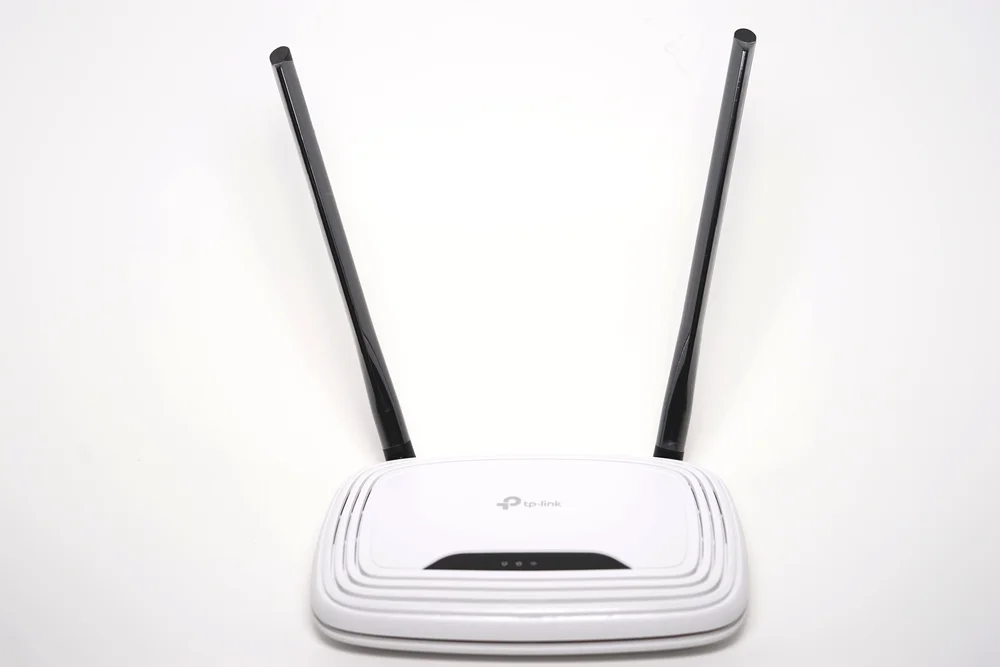
Figure 1 - The TP-Link TL-WR841Nv14 Router
This router uses IEEE 802.11n technology and provides up to 300 Mbps throughput. It has two non-detachable antennas. The case of this router is held down by two screws from the bottom of the case only. There’s no screw hiding under the label.
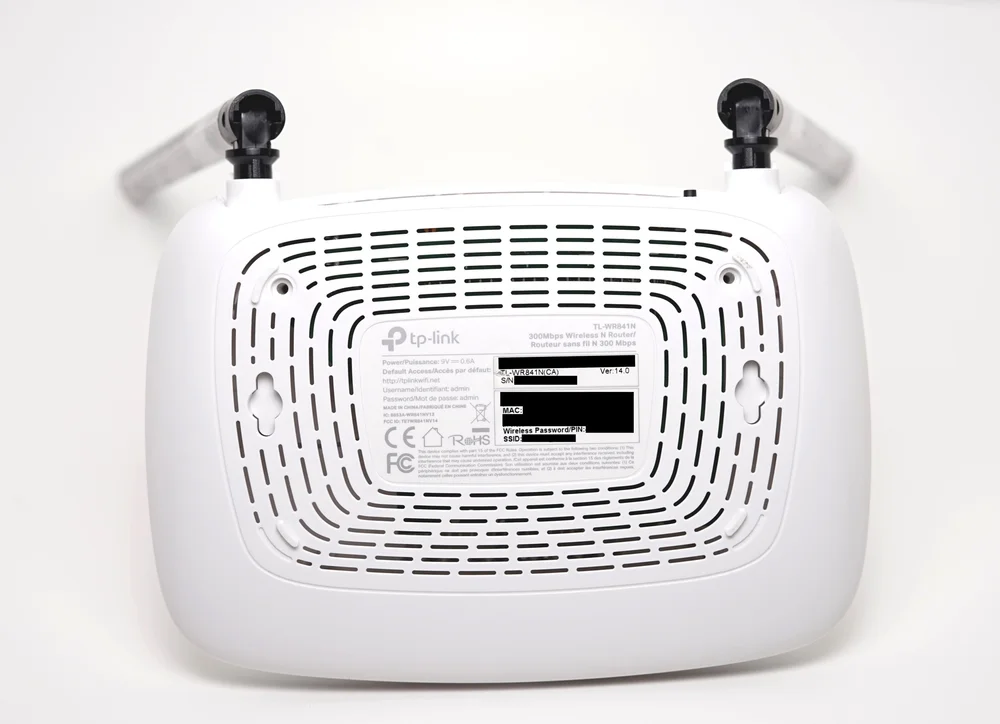
Figure 2 - Bottom of router
In addition to the screws, the case is securely fastened by 7 additional clips. We spent quite a while undoing the clips. The clips are quite robust and resist forceful entry.
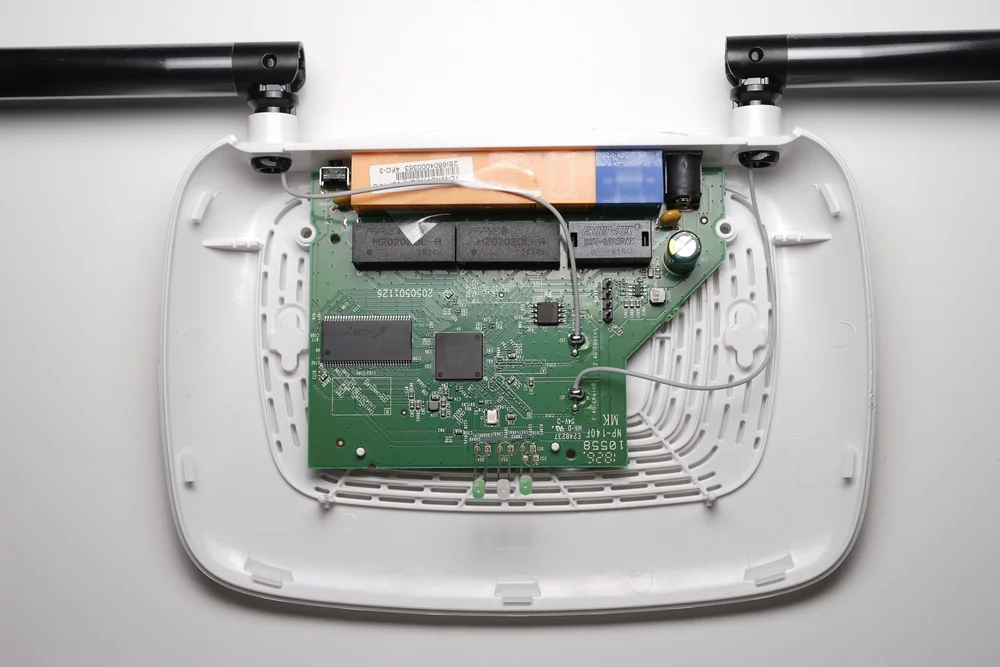
Figure 3 - Internal view of the router
With the case open, we can see all the major components: a MEDIATEK MT7628NN system on a chip (SoC) with a MIPS24Kc processor, a ZENTEL A3S56D40GTP-50 256MB SDRAM, and the GigaDevice 25Q32CSIG SPI Flash Memory.
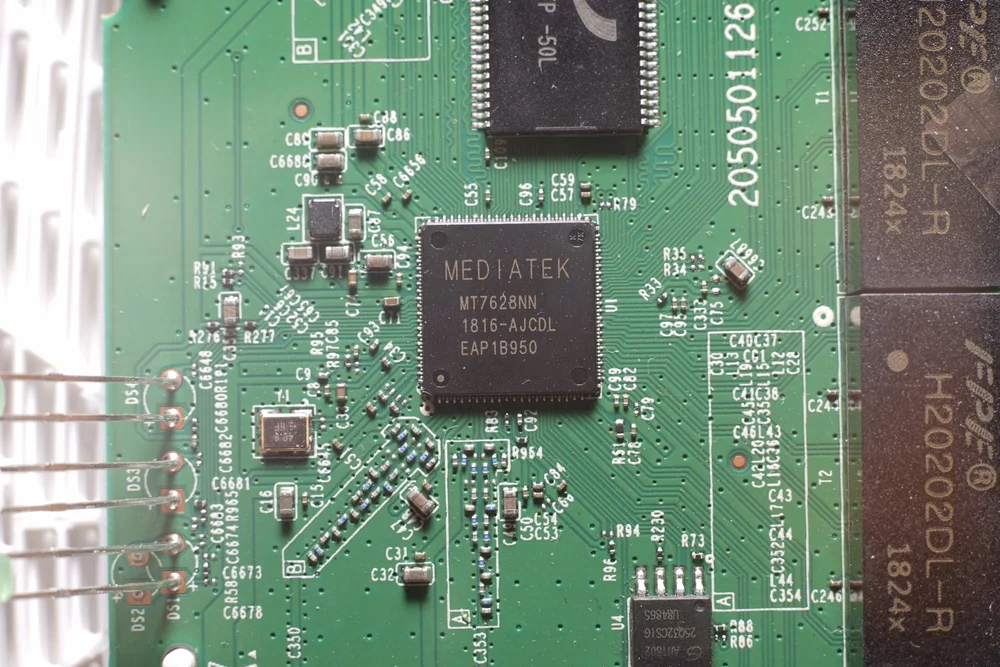
Figure 4 - Close up view of the MEDIATEK MT7628NN SoC
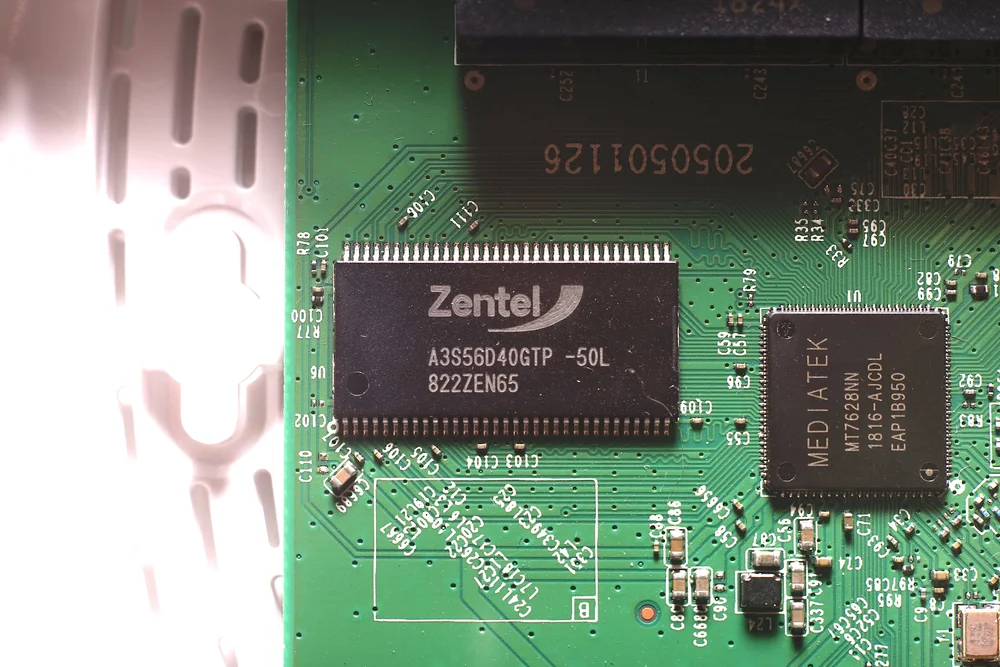
Figure 5 - Close up view of the Zentel SDRAM
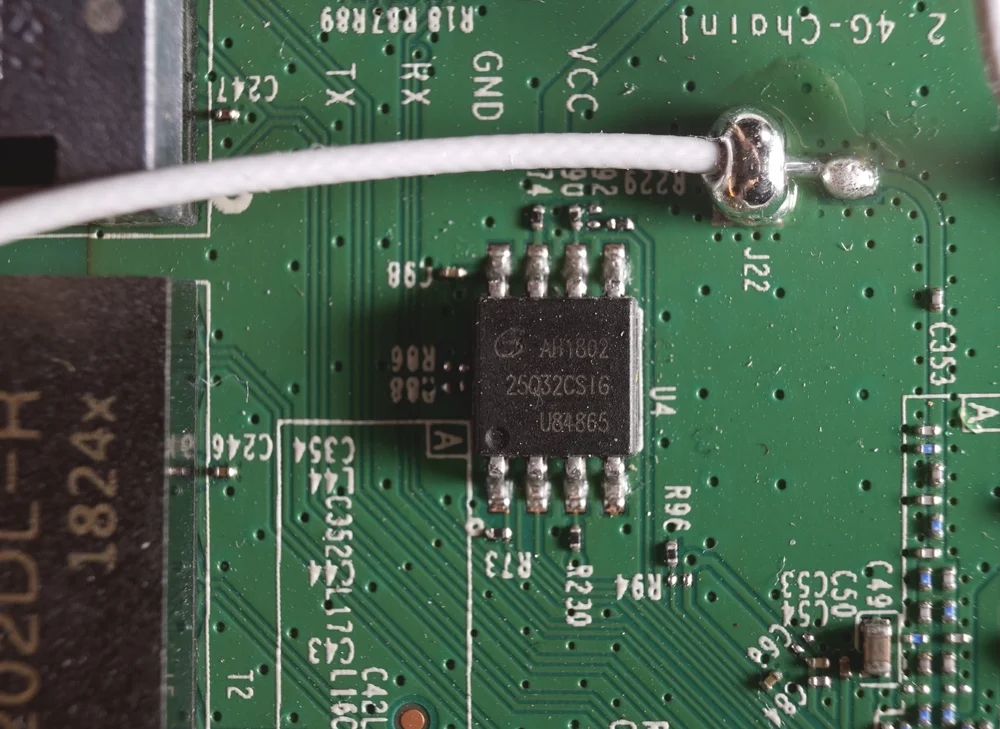
Figure 6 - Close up view of the GigaDevice SPI Flash Memory
The board is held in place by 4 registration marks, without using any screws. The lower surface of the PCB contains only soldering pads for through-hole components. Surface mount components are populated exclusively on the top surface. These are all design details that indicate the PCB is highly optimized for cost reduction.
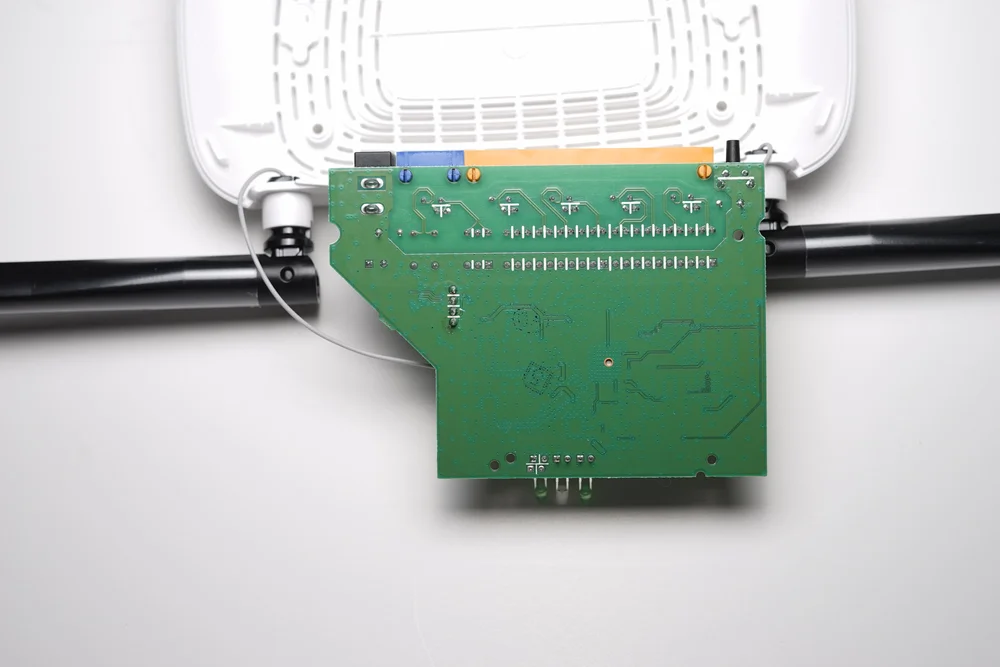
Figure 7 - Lower surface of PCB
Near the front of the board there is a UART debugging interface at J1 near the SPI flash. The circuit designer kindly labeled the RX and TX pins. A quick measurement on the Vcc pin with a multimeter suggests that it is a 3.3V interface. We soldered on some pin headers for convenience.
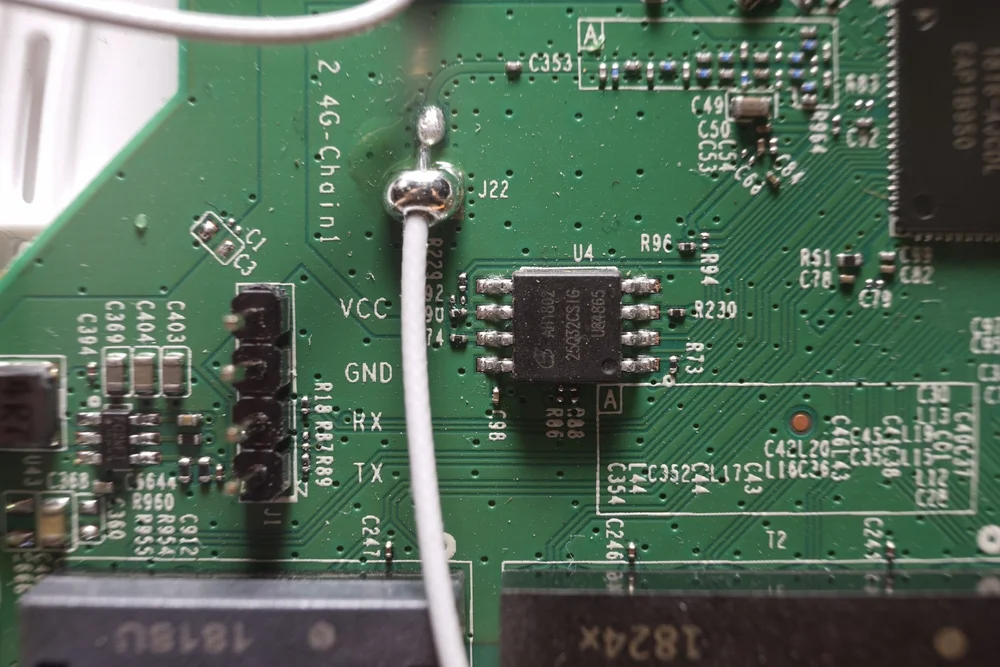
Figure 8 - Close up view of the UART debugging interfaces
Getting shell
In our lab, we only have a . The logic level shifter allows our 5V cable to communicate with the 3.3V UART interface by shifting the 5V signals from the USB to 3.3V signals that the router requires. Let’s connect the RX, TX and Ground pins of our 5V cable to the 3.3V UART interface of the PCB through the logic level shifter. We intentionally left the Vcc pin unconnected to avoid damaging the target board.
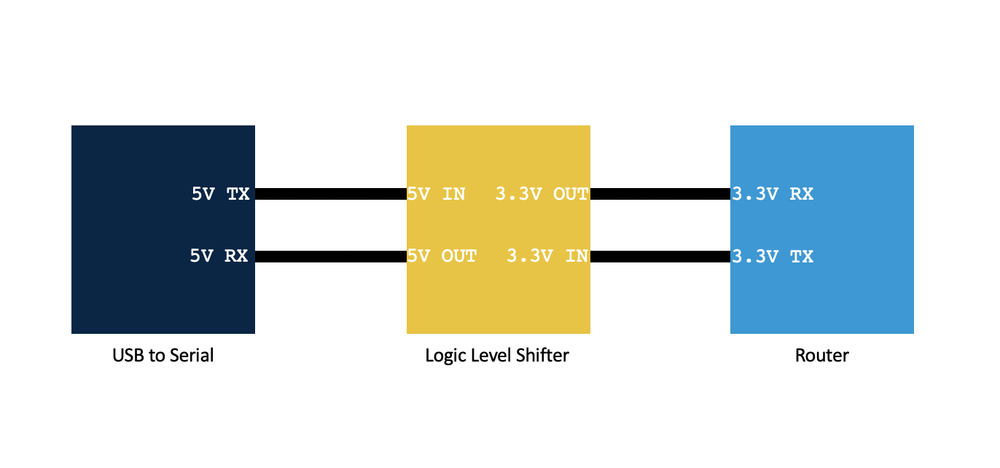
Figure 9 - Block diagram of the serial communication set up
Using website.
Using the mount command, we can see that /var is the only available partition to store our BusyBox binary. Since /var is a ramfs type filesystem, the file we write to it will be gone when the router reboots.
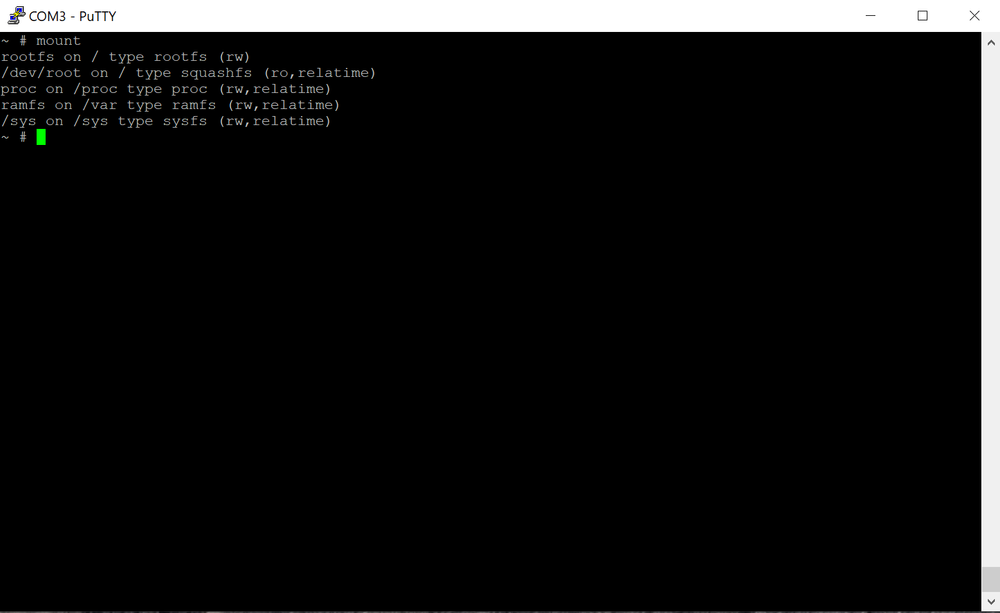
Figure 18 - Determining the writeable locations on the device
We can transfer the BusyBox and gdbserver binaries onto the router using the following commands:
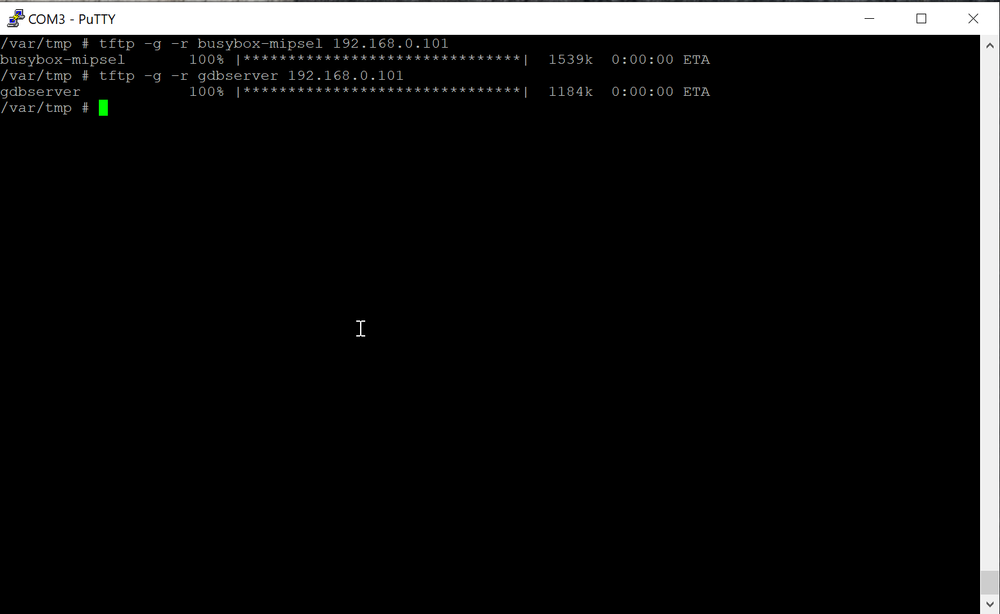
Figure 19 - Installing BusyBox and gdbserver
After adding execution permission to the binaries, we can execute our version of BusyBox and have access to more Linux utilities.
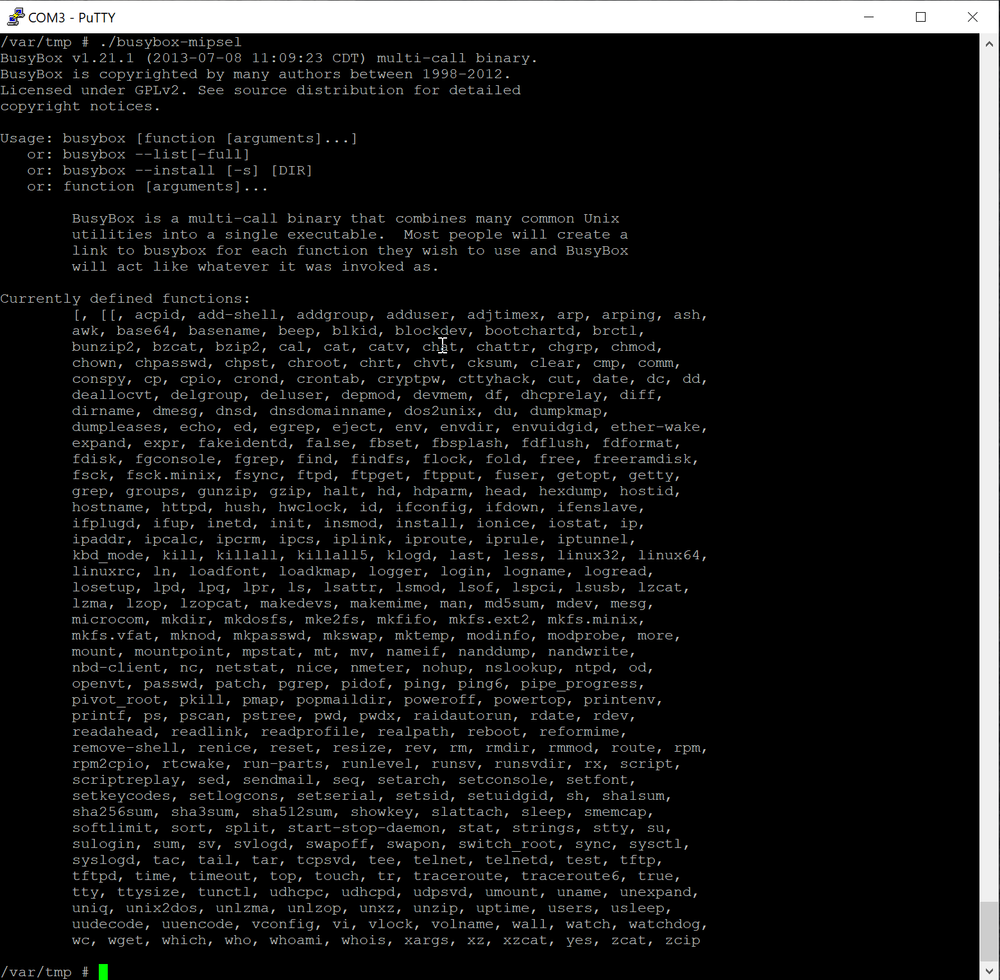
Figure 20 - Available commands with full BusyBox installed
Setting up GDB
Let’s say we want to debug the dropbear SSH server on the router. Before we launch the GDB server, we should extract the target binary and save it to the machine that is going to run the GDB client. This will help in the step of loading debugging symbols into the GDB client.
After finding out the PID of the dropbear SSH server, run the following command on the router to start a GDB server:
gdbserver localhost:23947 --attach <PID>
On our GDB client machine, we’ll run the following command:
gdb-multiarch -x dbgscript
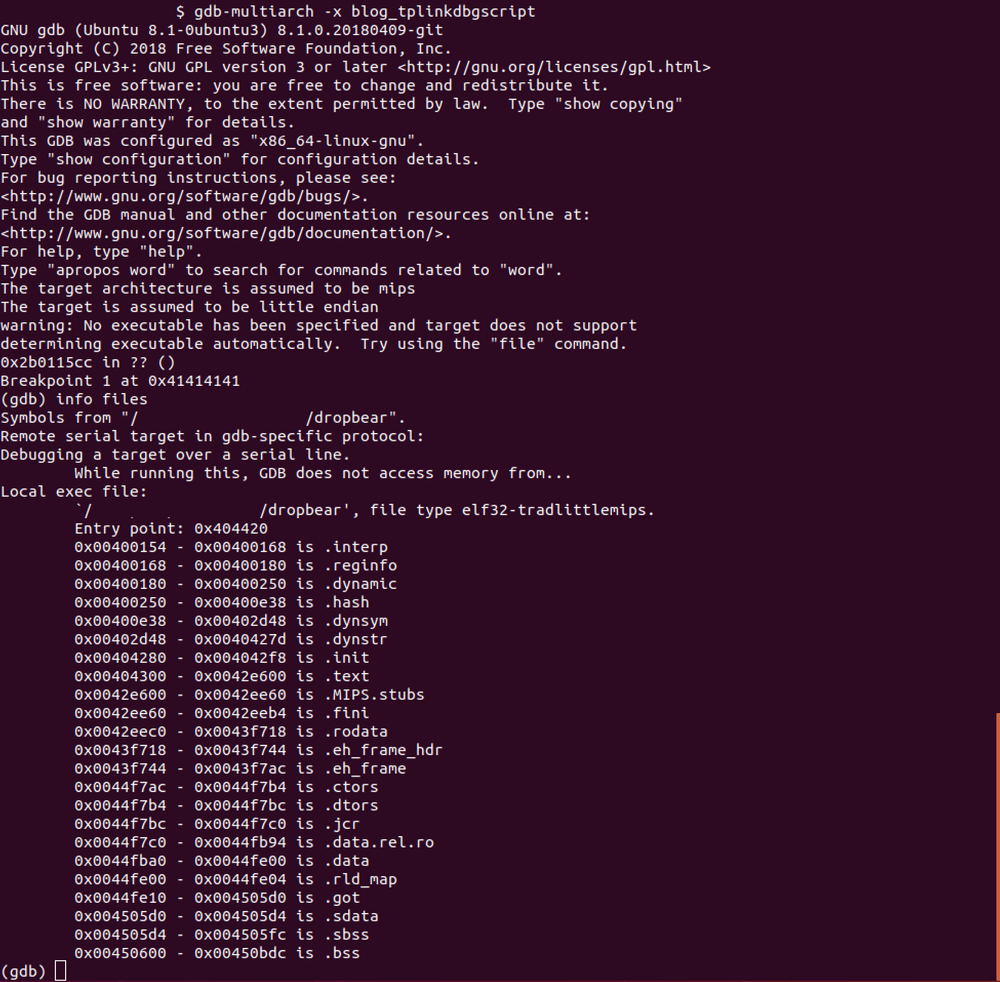
Figure 21 - Output from GDB Session
Contents of our gdbscript follows:
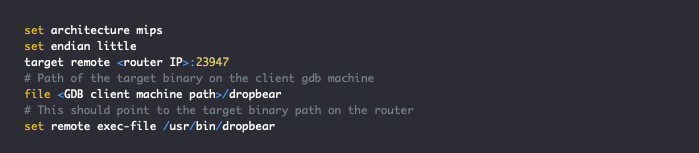
And there you have it! We have now successfully connected to the gdbserver. With some luck and hard work, you should be able to find some bugs and make something like this happen:
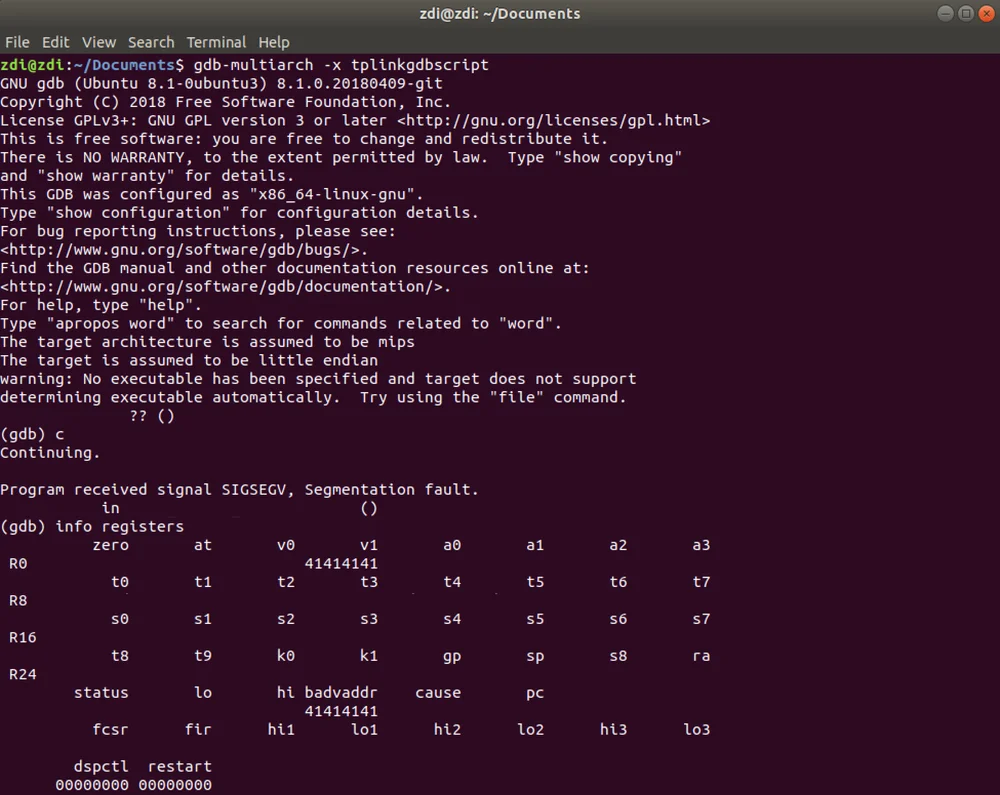
Figure 22 - Output from GDB Session Crash
Conclusion
Many researchers hesitate to delve into hardware vulnerability research. One of the many reasons is that things may not work as expected despite following the steps outlined in the tutorial exactly. When this happens, first verify each component works individually. Then, from a known working component, verify connections by measuring continuity, voltages, and signals. Work your way out from the known working component and hopefully you will soon discover the culprit. Finally, having access to an oscilloscope is instrumental in troubleshooting hardware. Getting a good one will serve you for many years to come.
I hope to see your hardware-related submissions in the future. Until then, you can find me on Twitter for the latest in exploit techniques and security patches.

SOCIAL SHARE CARD GENERATOR