Reporting in Excel Could Be Costing Your Business More Than You Think — Here’s How to Fix It…
Discover how you can save hours, eliminate costly data errors, and free up your team to focus on insights that drive real business growth.

Disclaimer: I am not affiliated with any of the tools mentioned in this blog; I’m sharing them because I’ve found them to be highly effective for the tasks at hand.
Recently, I collaborated with two agencies, both seeking a similar, straightforward solution:
To automate their monthly and quarterly reporting processes and present the data on visually appealing dashboards for their clients.
Both agencies were grappling with similar data challenges, which led me to think these issues are likely common across many agencies. This prompted me to write this blog, aiming to share useful insights and offer practical solutions.
Below are the key reporting-related challenges faced by the agencies
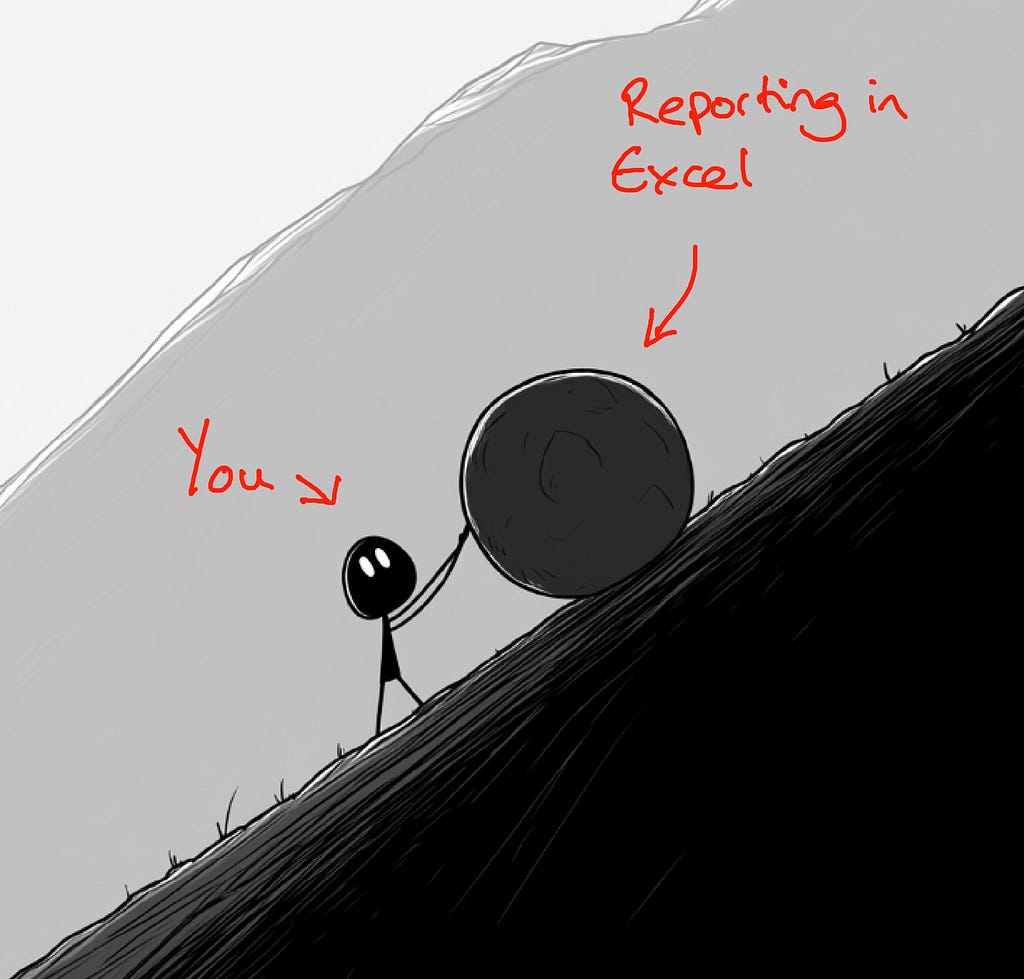
1. The agencies were spending far too long compiling reports into Excel
Reporting sometimes took days to complete. One agency had to gather reports from multiple global markets, while the other relied on several staff members across the business to update and send the data from their systems. If someone was on annual leave, that data point was simply marked as ‘TBC’ in the reports.
2. Attempting any deeper-level analysis proved to be challenging
Issues with Excel’s stability & scalability:
Both agencies were handling large volumes of data, and, as many of us know all too well, Excel has a tendency to struggle and crash under these workloads. This frequent freezing and crashing in Excel, particularly during pivot creation, made deeper analysis very cumbersome. The teams often had to force Excel to restart, sometimes risking the loss of their work.
The limitations of Excel’s visualisations
Excel offers a relatively limited range of visualisations, making it harder to present data in diverse, insightful ways. While simple visuals are often the best choice for final presentations, the exploratory phase demands more advanced visuals to analyse data from multiple perspectives and uncover deeper insights.
Excel offers limited interactivity between visualisations compared to more advanced tools, which provide a more seamless and dynamic experience for data exploration. For instance, in a tool like Power BI, you can click on a region within one visual, and all related visuals (such as sales trends, customer demographics, or product categories) immediately update to display only the relevant data for that selection. This level of interactivity is invaluable for uncovering deeper insights and understanding the factors behind changes in the data.
The importance of Deeper analysis
Deeper analysis is crucial for making the most impactful decisions each month. It’s what separates a standard report that simply shows whether numbers are up or down month-over-month from a truly exceptional one, where you can propose proactive solutions, craft innovative strategies, and uncover untapped opportunities. By investing time in this level of analysis, you not only address immediate concerns but also position yourself as a key partner in your client’s long-term growth.
3. Excessive time and resources spent on creating visually appealing graphs outside of Excel
Because Excel’s visualisations tend to look a bit, well, clunky, one of the agencies outsourced the creation of polished, branded visuals to their designer each month. As with most design projects, this involved a lot of back-and-forth discussions about how these new visuals should look.
4. Data skills gaps led to inaccurate reporting
The reporting was managed by someone without the necessary experience to fully understand Excel’s quirks , and understandably so, as it wasn’t part of their core role. As a result, both agencies unknowingly reported incorrect numbers. For example, even though the Revenue column was set to ‘Currency,’ entries like ‘USD123’ and ‘ 123’ (with a space) were excluded from the total because Excel didn’t recognize them as valid currency values. While Excel does offer a Data Validation feature to restrict entries to decimals or whole numbers, it must be applied manually, and many users aren’t aware of it. In my opinion, Excel should flag these discrepancies by default.
So what was the solution to the agencies’ reporting woes?
This example is from just one of the clients, as their case was more comprehensive:
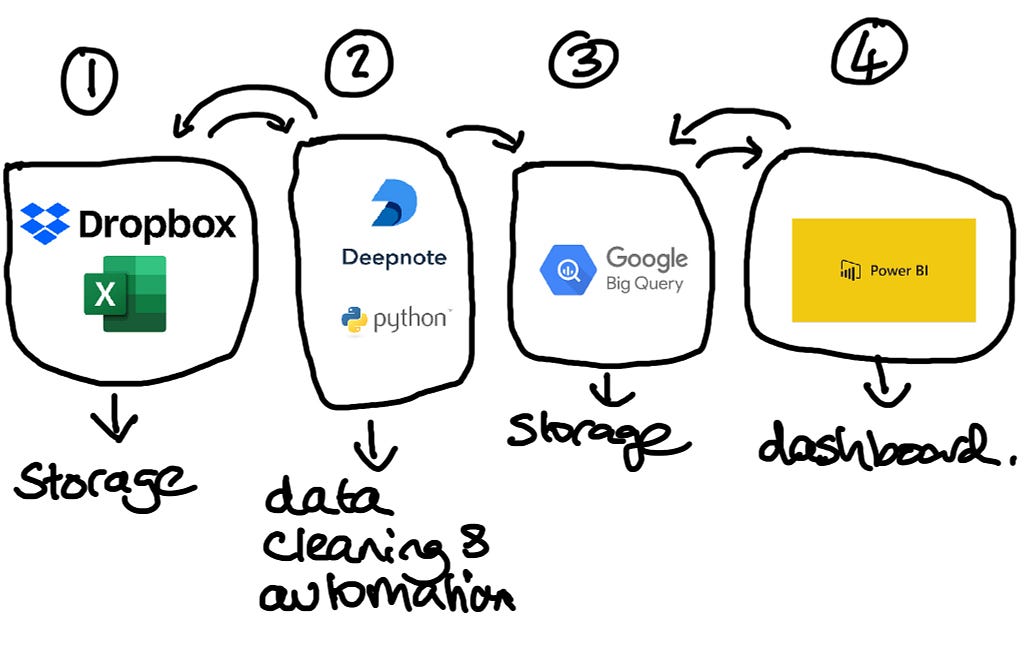
:
This is where I spent the majority of my time, using Python in a Deepnote notebook to thoroughly clean the data and then automate this process every month. Below is a snapshot of a Deepnote Python notebook. I’ve outlined in the cells the steps I took to pull, clean and push the data:
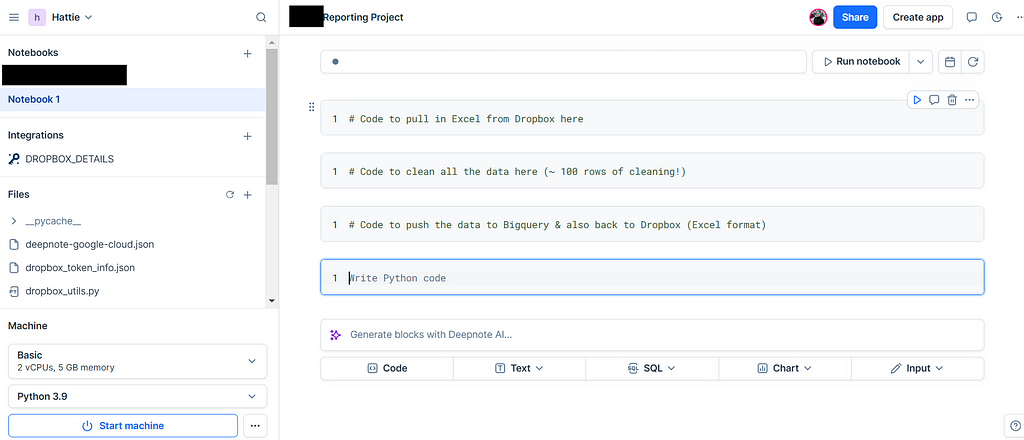
3.
Users have been empowered to perform deeper-level analysis
The dashboards offer advanced, connected visualisations that enable deeper analysis. Fully shareable across the team, they allow for more detailed, sector- and team-specific insights, empowering everyone to make more informed decisions.
Data is accurate
Crucially, the numbers are now accurate, free from the quirks and limitations often associated with Excel.
No need to outsource a designer or rely on third-party tools
Stunning, branded visualisations can now be created directly in PowerBI and easily embedded into PowerPoint, eliminating the need for designers or external visualisation tools.
The agencies are now more savvy about what’s possible with data
As with all my clients, I took the time to educate them on the full potential of Excel, Power BI, and Python. By co-piloting with their teams, I helped close the data skills gap, highlighting Excel’s quirks while introducing the power of Python and notebooks to unlock even greater insights.
In conclusion, Excel is a fantastic tool up to a point. Like a reliable car, it gets you where you need to go most of the time. But when the road gets more challenging, sometimes you need a more powerful vehicle to keep moving forward.
As of August 2023, although Excel now integrates Python, it does come with some limitations, which you can read about
on Medium, where people are continuing the conversation by highlighting and responding to this story.

SOCIAL SHARE CARD GENERATOR