A confusion matrix is a table used to evaluate the performance of a classification model by showing the true and predicted classifications for a set of test data. It helps in visualizing and analyzing how well the model is performing, especially for multi-class classification problems. The confusion matrix provides a detailed breakdown of the correct and incorrect predictions, making it easier to understand the types of errors the model is making.

Accuracy: The proportion of correct predictions (both true positives and true negatives) out of all predictions.
Accuracy = (TP + TN) / (TP + TN + FP + FN)
- Precision: The proportion of true positive predictions out of all positive predictions made by the model.
Precision (Positive Predictive Value) = TP / TP + FP
- Recall (Sensitivity, True Positive Rate): The proportion of actual positives correctly identified by the model. Recall represents from all the positive classes, how many we predicted correctly.
Recall should be as high as possible.
Recall = (TP) / (TP + FN)
The term “recall” reflects the model’s ability to “recall” or recognize as many true positive instances as possible from the actual positive cases in the dataset. It focuses on minimizing the number of false negatives, ensuring that the model identifies the majority of relevant instances.
- F1 Score: The harmonic mean of precision and recall, providing a single metric that balances both.
F1 Score = 2 * (Precision * Recall) / (Precision + Recall)
- Specificity (True Negative Rate): The proportion of actual negatives correctly identified by the model.
Specificity = TN / (TN + FP)
- ROC-AUC (Receiver Operating Characteristic - Area Under the Curve)
The ROC curve plots the true positive rate (recall) against the false positive rate at various threshold settings. The AUC (Area Under the Curve) represents the likelihood that the model will rank a randomly chosen positive instance higher than a randomly chosen negative one.
https://developers.google.com/machine-learning/crash-course/classification/roc-and-auc
PR-AUC (Precision-Recall Area Under the Curve); The Precision-Recall curve plots precision against recall at various threshold settings. The AUC represents the balance between precision and recall across different thresholds.
Logarithmic Loss (Log Loss): Log Loss measures the performance of a classification model where the output is a probability value between 0 and 1. It penalizes incorrect classifications with more confidence more than those with less confidence.
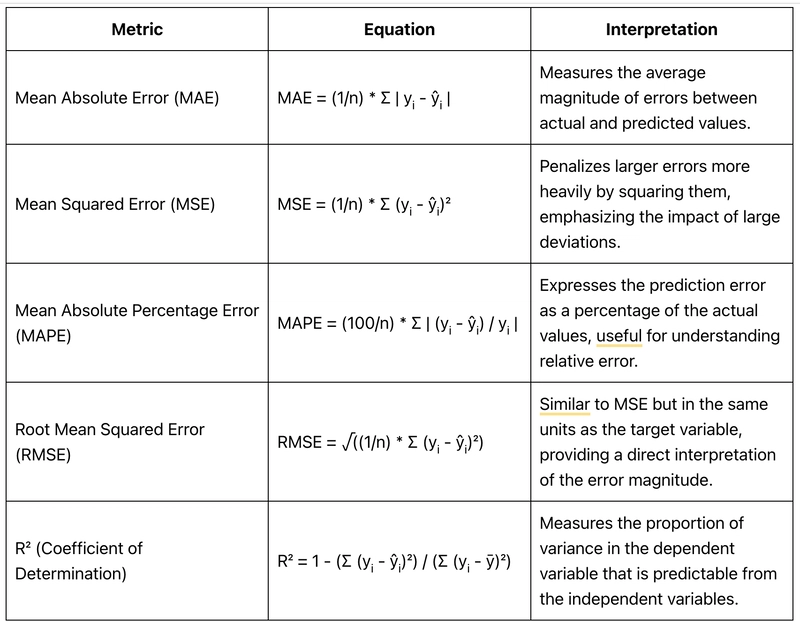
Mean Absolute Error (MAE): MAE measures the average absolute difference between the predicted values and the actual values. It provides a straightforward interpretation of the error magnitude.
Mean Squared Error (MSE): MSE measures the average squared difference between the predicted values and the actual values. It penalizes larger errors more heavily than MAE, due to the squaring of the differences.